Power BI: Why Create a Dashboard?
BY: David Rohlfs
Introduction
If you clicked on this blog, chances are that you want to learn more about the reason behind creating a dashboard for a Power BI report. Lucky for you, there are a lot of reasons explained in a lot of places.
This blog will cover when you may want to use a dashboard and some simple ways that you can create a dashboard.
When to use it
The main time that you will use a dashboard is when you want to personalize a reports information. Think of a dashboard as a spot where you can put all the information that only you or your immediate department care about. An ideal situation where you would want to start creating a dashboard is in the scenario below:
Your IT department sent out a report that had all the company’s information put into one report. This report had information about HR, Sales, Accounting, etc. Now there was security with this report in the form of RLS through Power BI (So you couldn’t see everything). But the issue is that you only care about the three visuals on the sales page that is at the end of the report. You have a couple of options in this scenario. You can go to your report builder and ask for a report only on Sales, you can click through the X number of pages to find the three visuals you care about, or you can create a dashboard with the visuals and information that you want.
A dashboard’s goal is to simplify your report into only the information that you want to see and read about. But there are a couple of things to question when you are thinking of creating a dashboard:
- Who is going to use this dashboard? Is it just you, or is this dashboard going to be used so much that you may want to create it for a team or department?
- Who is going to have access to the information in the dashboard? If you are in the scenario above, you’ll note that the original report had Row Level Security in it. If you take those visuals, the only people that can read the information are the same people that had access to it in the original report.
- Is this dashboard’s purpose to be made into an App? If it is, then you should be a lot more considerate on how you design the dashboard. Creating anything for yourself has different levels of needs than creating something for others. If you intend on creating a dashboard to put on an app, you should start asking yourself if you need to be more conscious of how the dashboard looks and what the data story is.
- Is this dashboard going to need so much information that it would be better to just build a report? Note: You should only ask this question if the intention is for many people to see this information.
If you do decide that making a dashboard is the right decision, there are a lot of ways that you can add visuals to a dashboard. Here is a list of the most common ways:
- Adding a visual straight from the report.
- Adding a visual from insights on the semantic model.
- Adding a visual from insights on another visual.
- Adding an entire report page to a dashboard.
There are a few more ways that you can add information, but those ways start getting into specific scenarios.
There is a fine line when creating a dashboard. You want to have enough information that the user of the dashboard will be able to understand the information, but you also don’t want too much information to where the dashboard feels overcrowded (thus not “personalizing” the dashboard).
I mentioned earlier about the ability to create an app from a dashboard. Because this is especially useful to someone who is sending information outside of an organization, I want to cover some of the advantages to creating a dashboard in this regard.
Walkthrough
In this walkthrough, I am not going to go through all of the ways that you should add a visual into a dashboard. To learn about several ways, I suggest going through Lab 4 of the Microsoft Power BI DIAD. Here is a link to this walkthrough: Dashboard in a Day Power BI Training | Microsoft Power BI
To start, we are going to go into a preexisting report and add in a couple of visuals to our dashboard. This will also automatically create a dashboard for us.
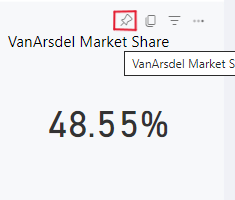
First, you will want to find a visual that you would like to have in your dashboard. Remember that the visuals that you choose should be the ones that you or the people that use this dashboard will care about most. To add a visual to the dashboard, lick in the thumb tack icon in the top right corner. Depending on where you are getting the visual from, the location of the thumb tack may move from corner to corner, but it will always be the same icon.
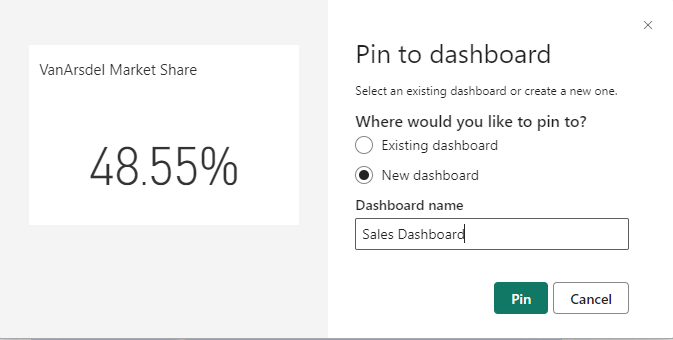
Doing this should bring a pop-out box. If you already have other dashboards in your workspace, then you may have the option to add to an existing dashboard. But for now, we are going to create a new dashboard by selecting this option. Now, you will need to name your new dashboard. This could be something like “David’s Dashboard” or “Sales Dashboard”, but the goal is to make it so that whoever is in the workspace understands what the dashboard is for.
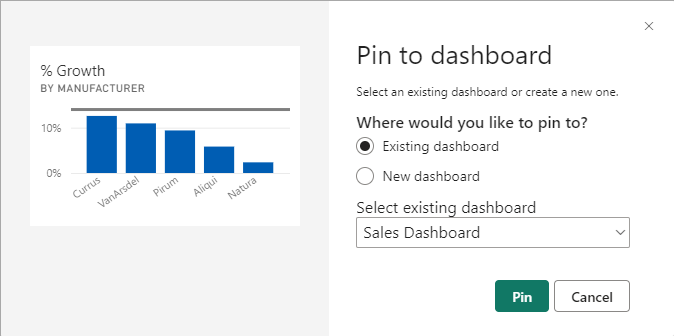
Once you click Create, you will be able to add more visuals into your dashboard. All you need to do is click the Thumb Tack icon and choose the dashboard that you want to send the visual to.
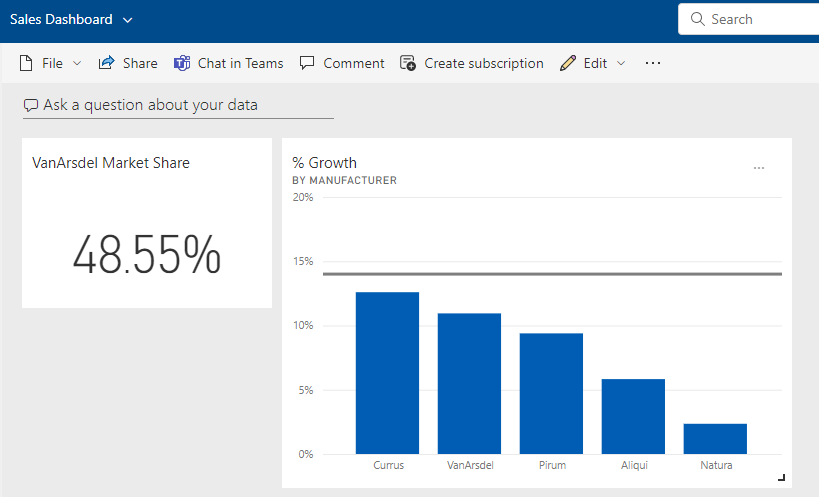
Once we go to our dashboard, you will notice that everything is likely out of size and ugly. To change the size, you just need to click and hold in the bottom right corner and drag towards or away from the middle. Notice that a dashboard will gray out the area that you are making the size to. There are some downfalls to having a dashboard and this is one of them. You are restricted to the preset sizes for a visual.
Conclusion
If you have never used a dashboard in Power BI before, or just have never known the advantages to having a dashboard, then I hope that this blog helped to explain some of the reasons for creating and using a dashboard. I you enjoyed this blog, please think about reading another one of EPM Strategy’s blogs that cover basic and advanced concepts for Microsoft Power BI!
Links:
Adding members to a workspace Blog
Comments
One Response to “ Power BI: Why Create a Dashboard? ”
[…] Power BI: Why Create a Dashboard? […]
Leave a Reply
You must be logged in to post a comment.