Power BI Row Level Security (RLS)
BY: David Rohlfs
Introduction
There are very few reports that have information that anyone can see. Thankfully Microsoft understands this and has built in tools that a report builder can use to protect their data. One of these built-in tools is the Microsoft Power BI Row Level Security (RLS). RLS can protect your data in multiple ways and uses both the desktop application and the service to help protect data.
This blog is only meant to be a brief description of the RLS capabilities of Power BI. There is a lot more information and in-depth tutorials of RLS on the internet if you are looking for in-depth descriptions.
In this blog we will go over when to use Row Level Security, common problems people face with RLS, and a walkthrough of the two methods for implementing RLS with a quick look at the use of RLS in the Power BI Service.
When to use it
There are many reasons that a report may utilize RLS, but the goal is that a user only sees data that they are authorized to view. With this tool, you are able to dynamically filter a user’s access to data, or you can use a static method. This gives a report builder the ability to personalize and protect reports that may otherwise cover a large scope of information.
Scenario: You work in a multi-national organization that sells coffee beans in the United States, Canada, and Europe. Your job is to create a sales report that the whole organization can use so that there is one source of the truth. But you cannot let one countries sales manager know the data from another country.
This is a very general situation of what could happen but describes a perfect scenario of when to use RLS in a report. Using RLS, the report builder would be able to categorize the information that each sales manager can see, while only building one report. Creating a situation where instead of three reports, there only needs to be one.
Row Level Security uses two different methods to achieve the same goal. The first method is static and involves setting up a view for each individual person inside of the Power BI desktop application. The second method is dynamic and allows for a report builder to use a spreadsheet or file that separates each user according to the information inside of the sheet. The Pro’s & Con’s for each method are listed below.
Static
- Pros:
- Quick to setup for a small number of users.
- No outside sheets that need to be setup.
- Easy to apply with any report.
- Requires less semantic model knowledge than dynamic.
- Cons:
- Can be tedious and repetitive.
- Is inefficient with large numbers of report users.
- Requires more work in the service than the dynamic method.
- Uses DAX to apply restrictions.
Dynamic
- Pros:
- Works great with more users.
- Can be updated without entering the desktop app.
- Is simple to setup inside of the desktop app.
- Cons:
- Requires use of excel.
- Requires refreshes to stay updated.
- Requires use of the principal name for each user.
- Can still take a while to setup.
- Requires use of desktop app.
Common Problems
Multiple Fact Tables:
This was a problem that I encountered when implementing RLS into a report. The resolution for this situation is to simply add more levels of security into each user’s role.
For instance, if you have a data model that looks like this:
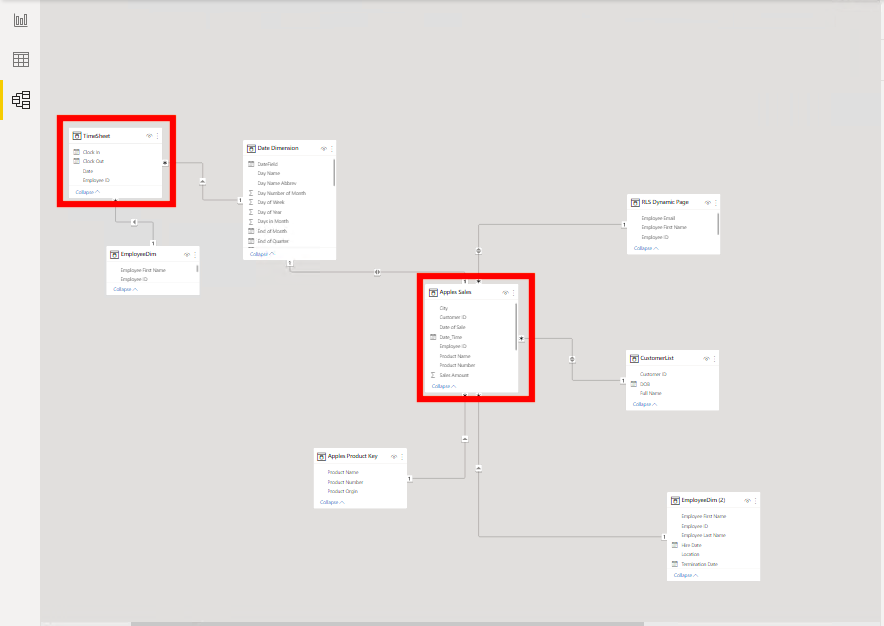
Then you may create a static RLS that has DAX on your Sales Table, and Time Sheet tables. If you are using a dynamic method, you can just add more columns to your external sheet and add DAX filters to tables inside of the Manage Roles pop-out. Make sure that you create relationships between all tables if you are using the dynamic method.
Multiple filters for each table:
From the example in “When to Use It”, if you want to let a person have access to both the United States and Canada you can use a DAX filter equation that looks like this:
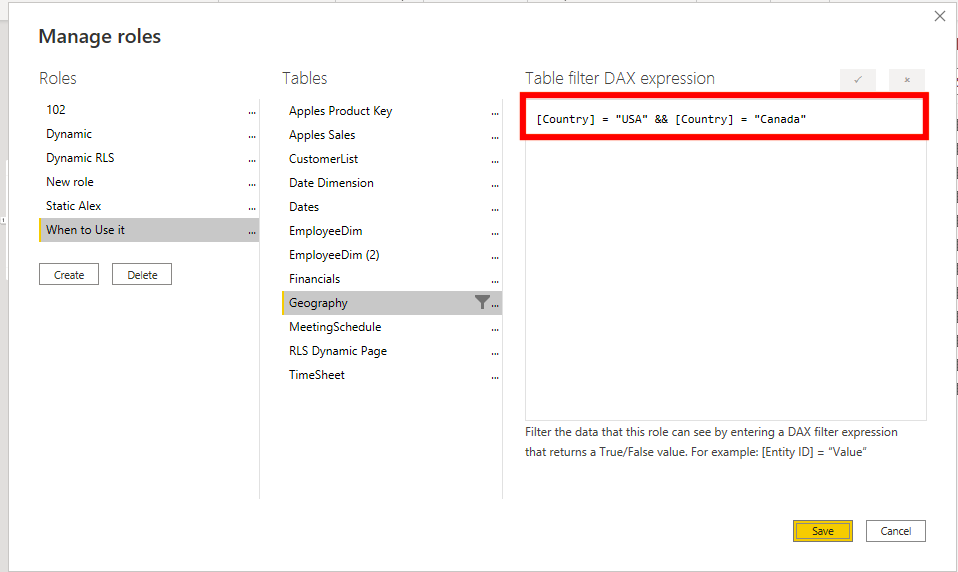
This equation just uses the && inside of the DAX equation to signify that you are filtering for USA or Canada.
Walkthrough
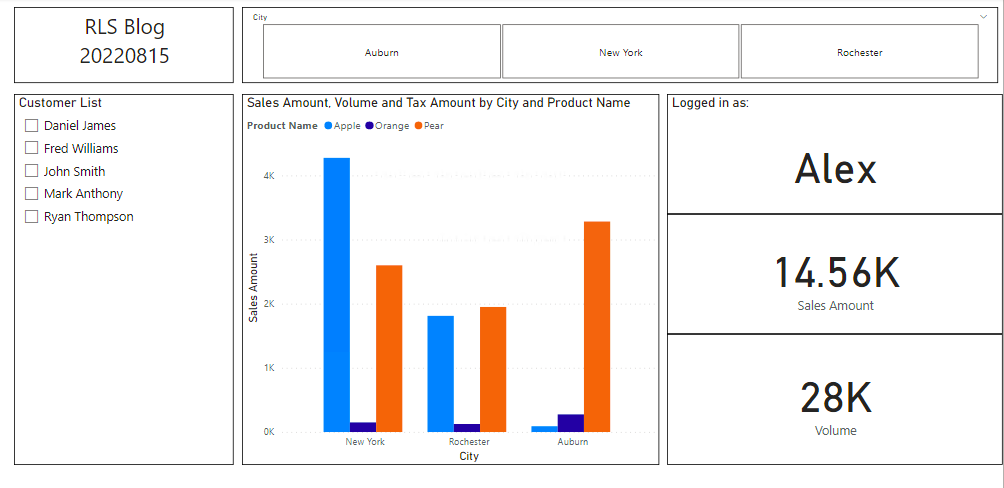
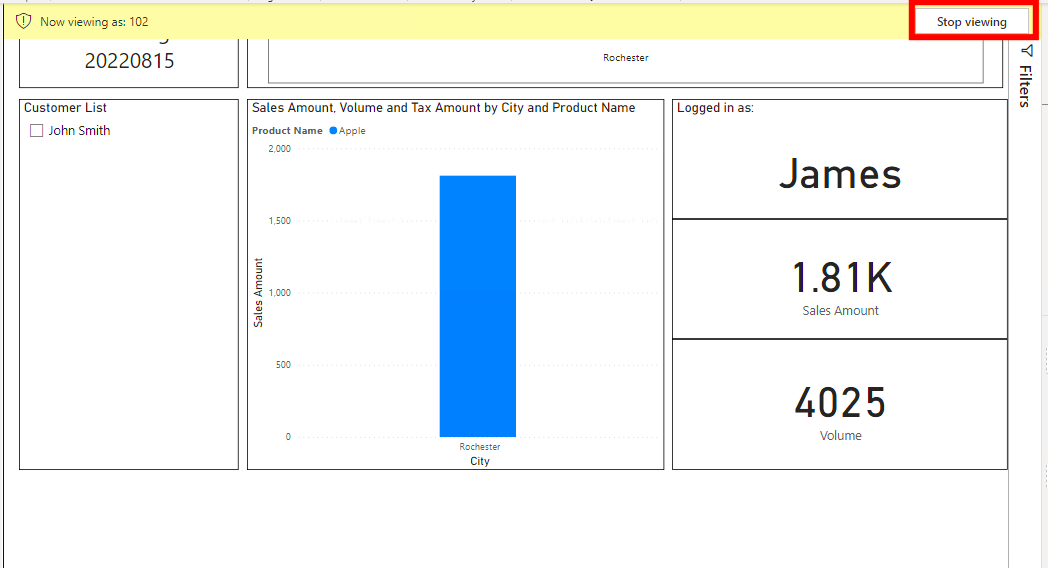
This walkthrough will present three different sections that cover the static setup, dynamic setup, and setup inside of the Power BI service. For both desktop walkthroughs we will be using a semantic model that looks at sales and we want to filter the data that someone sees by their employee ID. Both desktop walkthroughs will be using a page that looks like this:
Static Setup:
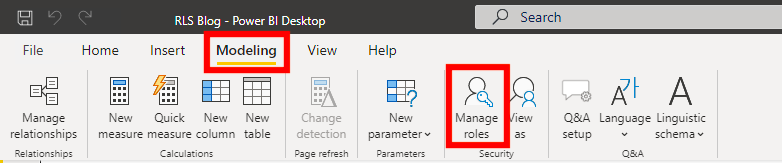
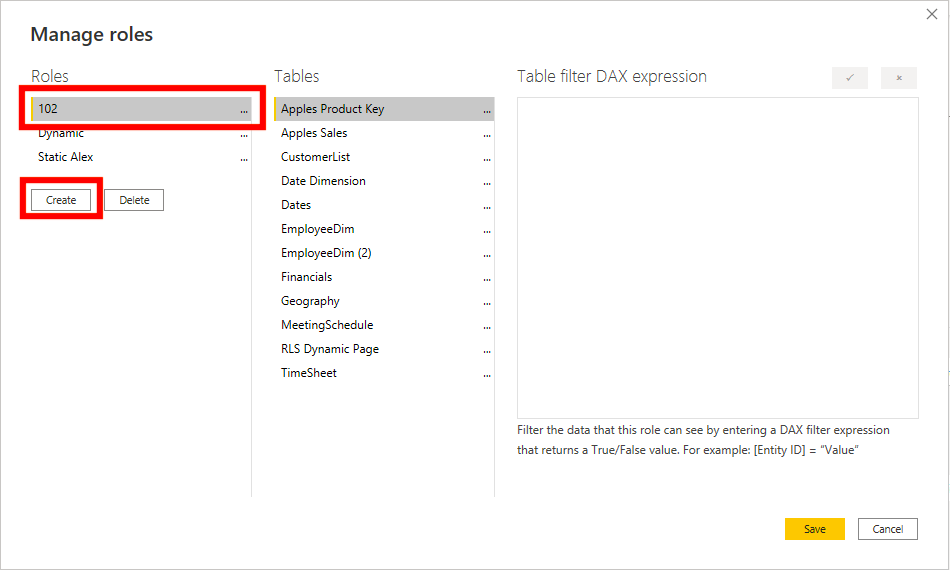
To start the static setup, go to the modeling ribbon, then manage roles. This is the spot where you will be doing most of your work for both methods.
In the pop-out, click on the create button and then rename your new role. I suggest using the same name or employee ID that you will be linking this role too.
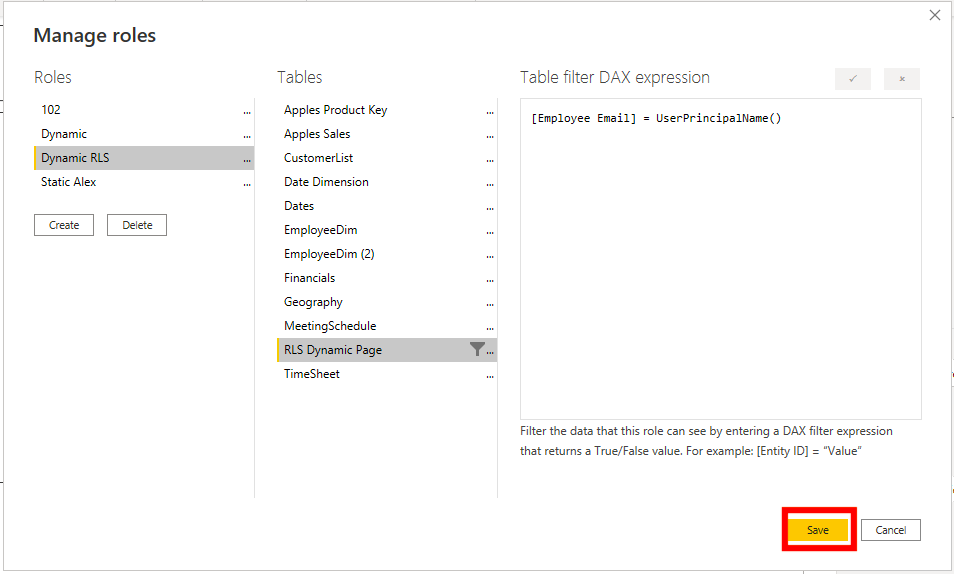
Now you can choose the table that you are applying the filter to, if using a star schema make sure that you use your fact table, then write out the DAX. Generally, your DAX will look similar to the equation I have in the image below.
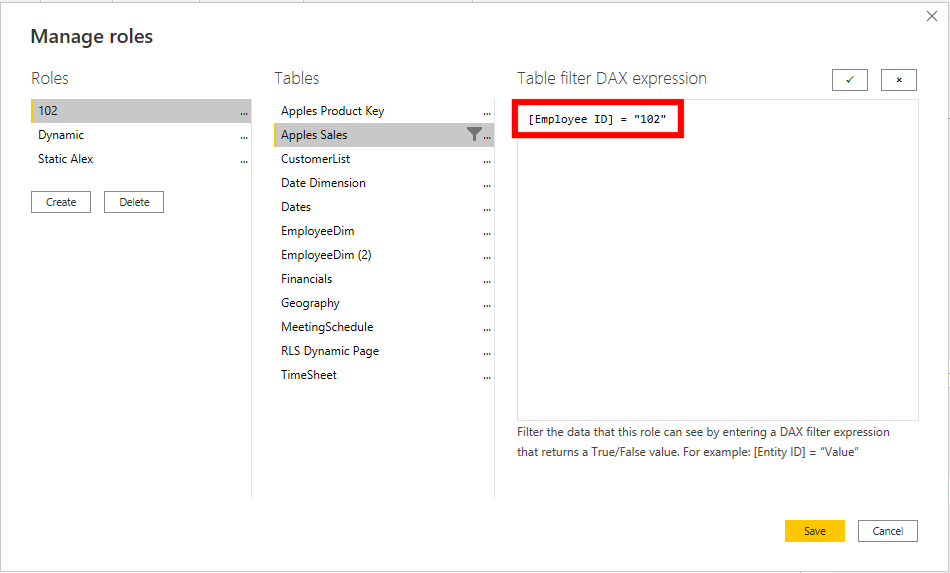
Note: To apply multiple filters, look at the common problems section above.
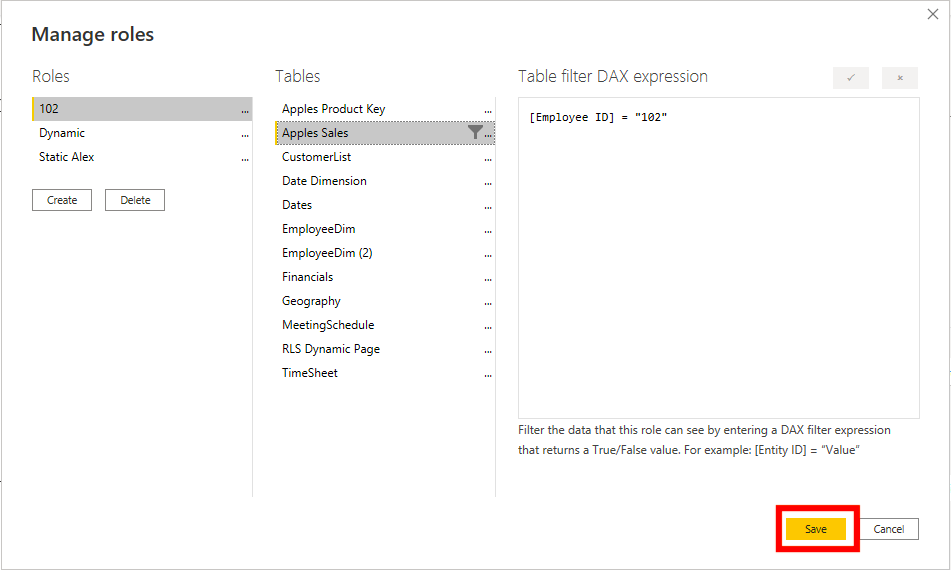
Once you complete your filter setup, you can click on the save button at the bottom right of the pop-out.
To check that your setup was correct, click on the View As button in the modeling ribbon and choose the role that you setup.
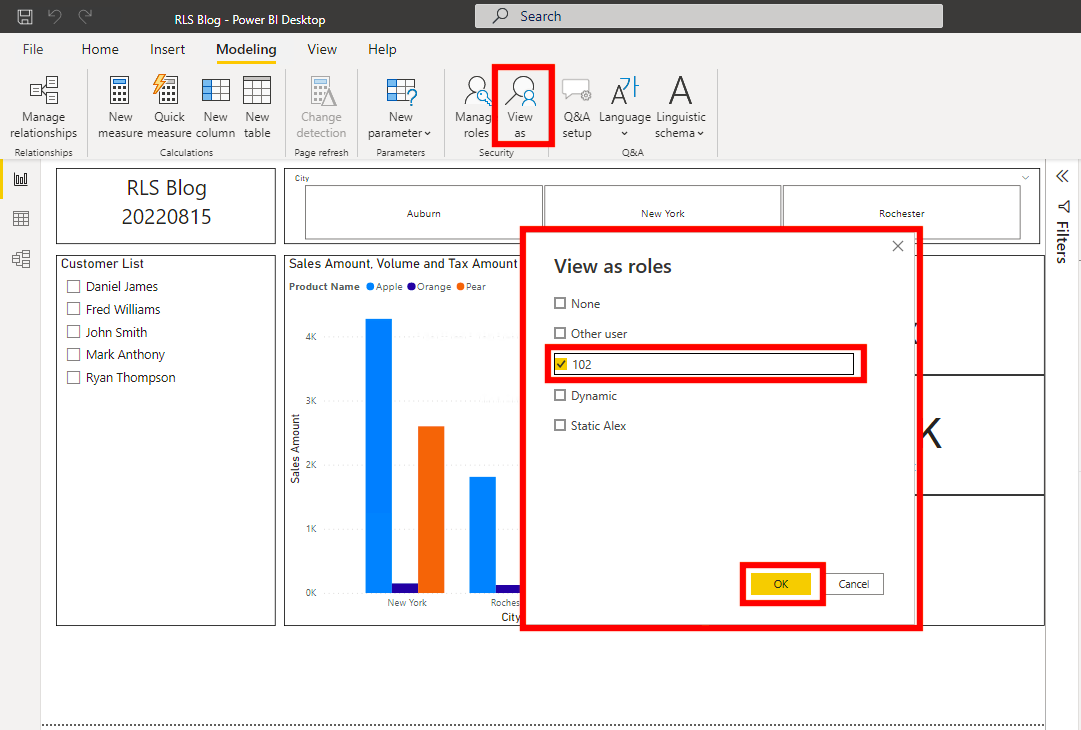
To exit the role, slick on the Stop Viewing button at the top of the canvas.
Dynamic Setup:
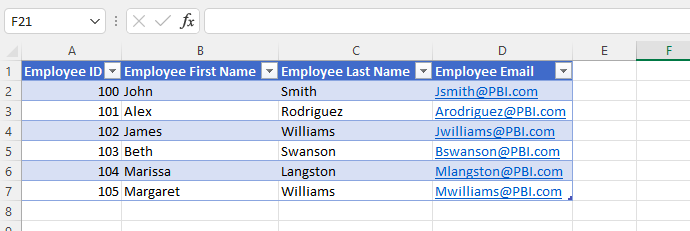
To start the dynamic setup, you will first need to create a table that contains the Employee ID (Filter Field), and the username that the report users will use. This can be an excel sheet or another form of table. Generally, the username will be their login email, but if you are using a different service than the Power BI Service you will need to enter the usernames your report users are using for that service.
This is what my spreadsheet looked like after I set it up. Notice that I added in the first and last name. The first and last names are entirely optional, but it may come in handy later on.
Now you can upload your table to Power BI Desktop. Then we will create a relationship between your new RLS page and fact table using the Employee ID field. To learn more about relationships you can read this EPM Blog, Power BI Basic Relationship Building.
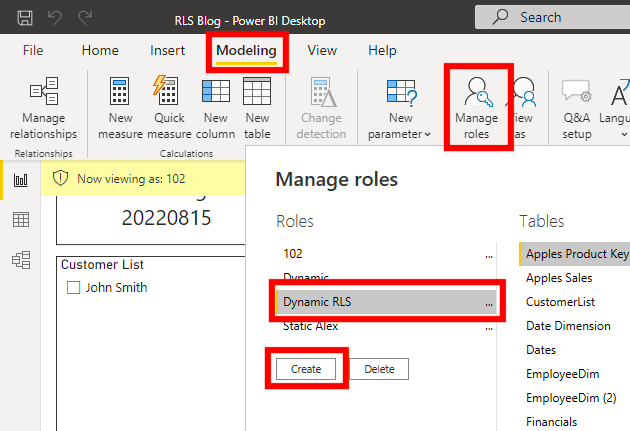
Now we will go to Manage Roles in the modeling ribbon then select create. Then you can rename this role as whatever you want. I chose to use “Dynamic RLS”.
For our DAX we will use the email we entered, then the UserPrincipalName () function. This is going to go into the Power BI service and filter by the login email that matches the email you entered in your table. Make sure that you use the table you just created for this process.
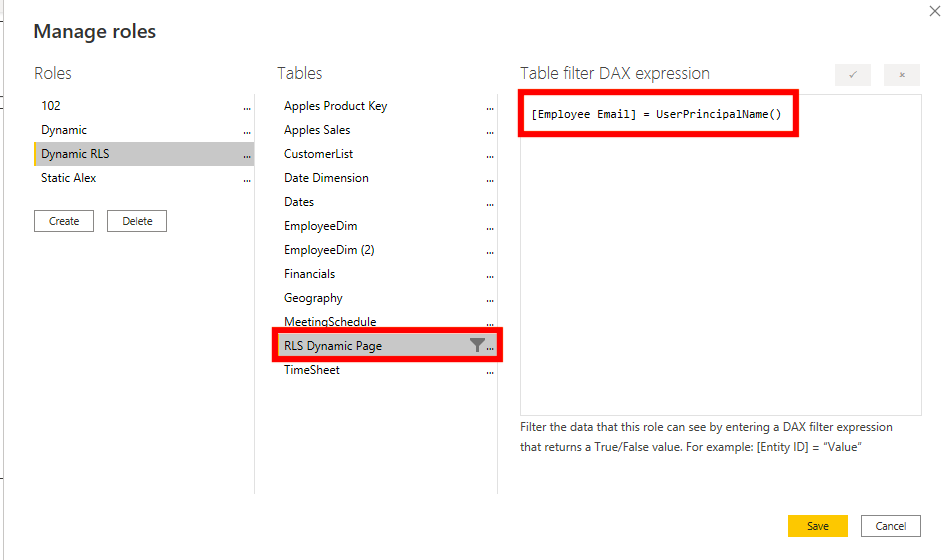
If you are using a different service than Power BI, you can just use the UserName () DAX function.
Now we can click Save.
To check your work, click on View As. Then select other and Dynamic RLS. In the other box enter an email that you want to check. Then click OK.
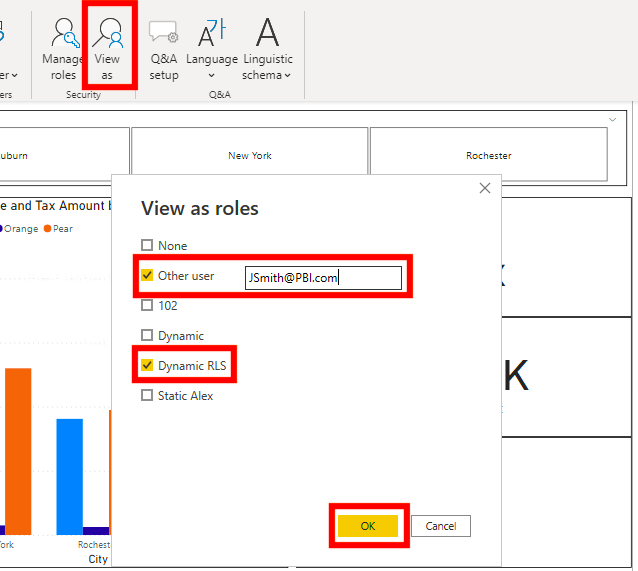
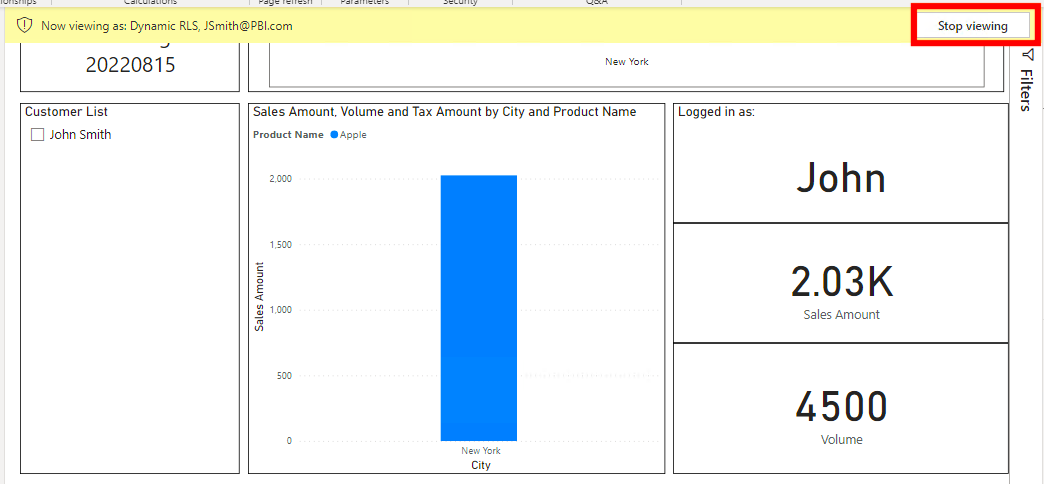
This will show you the data that that user has access to.
To exit this view, click on the Stop Viewing button at the top right of the canvas.
Power BI Service Setup:
To set up the service side of your RLS, make sure that you have first published your report to the Power BI service.
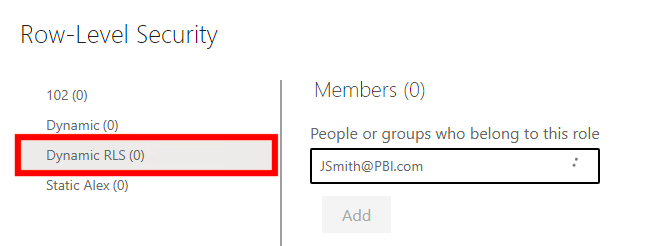
Now you can find your semantic model for your report, click on the ellipses, then select Security.
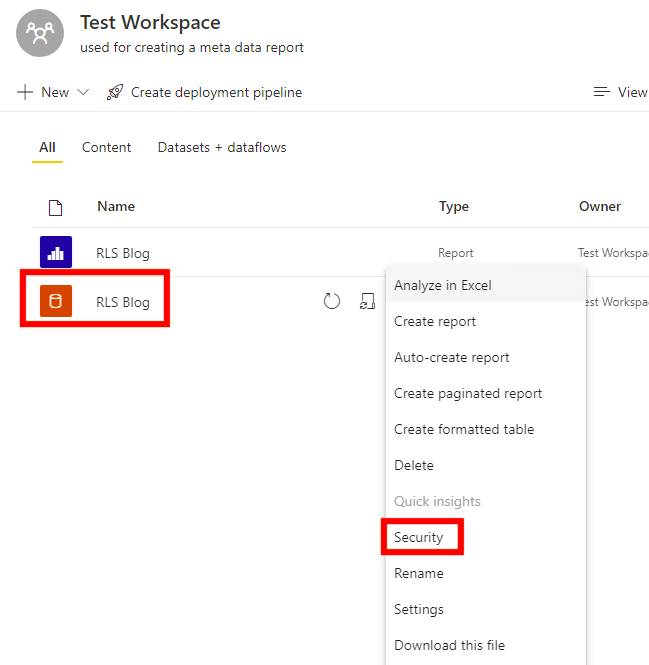
With the RLS that you want to put users into, you can enter the email of your users. If you are using Static RLS, make sure to have the correct role selected. If you are using Dynamic RLS, you should only need to enter the login email.
Note: You need to have the user added to the workspace for them to see the report. And, you do not need to have them added to the workspace before you add them to the security page.
Notice that we applied the RLS to the semantic model. This means that if we were to create multiple reports from the same semantic model, then the report builder would only need to setup the RLS once.
Conclusion
Even though there were multiple methods covered in this blog, there are many other blogs, videos, and training sessions devoted to row level security that go much deeper in explanations and understanding. Hopefully you learned something new in this blog and begin to implement RLS in your reports.
Note: There are many ways to do most things in Power BI. This blog is not meant to show every method that you can use RLS, or to show every aspect of the two methods described
Comments
One Response to “ Power BI Row Level Security (RLS) ”
[…] RLS Blog […]
Leave a Reply
You must be logged in to post a comment.