Power BI Basic Relationship Building
BY: David Rohlfs
Introduction
Relationships are very confusing at first, but as you grow in your skills with Power BI relationships can be an easier aspect of building your report. Relationships connect two or more queries within Power BI and can help to simplify and expand the information in your dashboard.
This blog goes through a quick explanation of what a relationship inside of Power BI Desktop is and it will show you when to use it, common problems that are related to relationships, and a quick walkthrough of how to build a relationship.
This blog will be a very basic representation of what can be done with relationship inside of Power BI Desktop. In the future we hope to write several more blogs about some of the intricacies in relationships and address some of the problems.
When to use it
What are relationships
Relationships in Power BI are the building block to connect multiple queries together. Relationships allow for information to be filtered on one field, then update the other field to reflect that filter.
What can it do
Building a relationship is very helpful to connect semantic models that are in the same dashboard. This is helpful to enhance your graphs, slicers, charts, matrixes, etc. When you build a relationship, you are allowing Power BI to make more complex filters and connections within your data.
Where you can see relationships
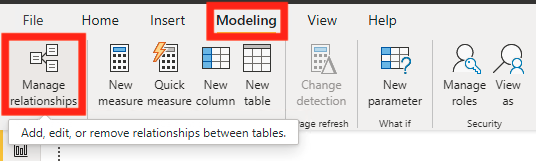
You can create relationships in the Manage Relationships button on the Modeling tab (Example 1). This is my preferred method of building and examining the relationships that I have in a report.
You can also see your relationships in the Model Page (Example 2). This is a more visual way of seeing the relationships that you have in a report, but it can get messy.
Using the Auto Detect Button
When you are in the Manage Relationships Pop-Out, there is an option to do Autodetect. This action can be useful for smaller semantic models as it shows all possible relationships that are available. But when your semantic model gets very large, it can often be an issue and make your relationships messy or inaccurate. For this reason, I try to avoid using it unless I am familiar with my semantic model, or I have a small semantic model.
Specific Columns
When you are connecting columns from two different queries together you need to use specific columns. These are columns where there are no duplicates, or there are only duplicates on one side of the relationship. If you do not do this you will get a “Many-to-Many” relationship, and these can easily cause a lot of problems (Look Below at Many to Many Relationships).
Most specific columns are already attached automatically when a sale or product is added to your excel file or ERP system. Some of the columns that I like to make relationships between are:
- Sales Order Number
- Product Number or Product Key
- Dates
- Customer ID Number
- Zip codes
- Shipment Number
- Some Text Fields
Understanding the Manage Relationships Pop-Out Page
For this we are going to look at the Manage relationships pop-out page.
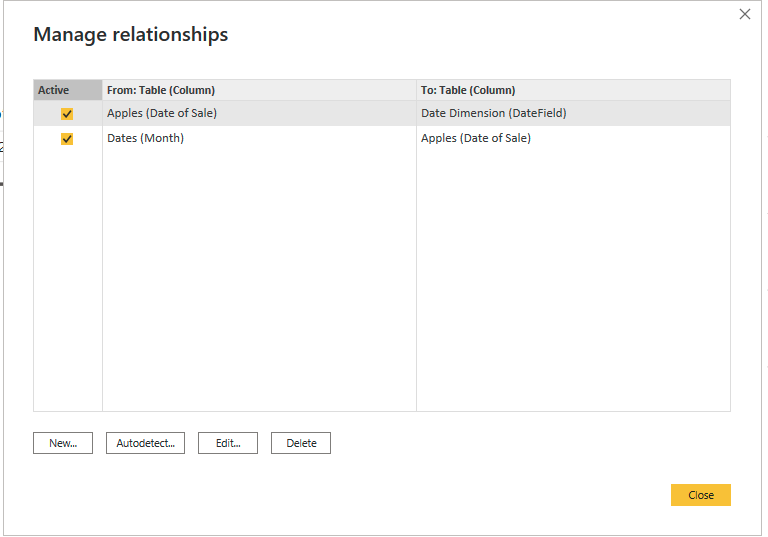
There is a column that identifies whether a relationship is active, the From Table column, and the To Table column. These depict what the relationship is, and in which queries it has the relationship. There are also buttons to create new relationships, autodetect relationships, edit existing relationships, and delete existing relationships.
Common Problems
Many to Many Relationships
This explanation will focus on Many to Many relationships as they are the cause of a lot of problems with relationships. A many to many relationship is basically saying that Power BI is confused on what it should do and where to look for related data. Power BI doesn’t like these relationships because it doesn’t want to show incorrect data, but it is very hard for it to know if it is correct when there are many to many relationships. In other words, avoid using many to many relationships in your report.
To understand many to many relationships think about trying to match two identical apples with two identical oranges. But one specific apple must go with one specific orange. Since you can’t tell the difference between them, you must guess; and that is essentially what Power BI has to do with Many to Many relationships.
One way that you can avoid many to many relationships is by checking if there are duplicates in semantic model. To do this you can use the Group By function in your power query, or the remove duplicates function in your power query. EPM strategy has written blogs focusing on both functions so please go read them for more information on duplicates (https://epmstrategy.com/tools-for-you/blog/).
Relationships can’t be a circle (Dotted Line or Inactive)
Another problem that is very common is that your relationships create a loop in your report. When this happens Power BI will automatically deactivate one of the relationships leaving a relationship inactive or represent it by a dotted line. To avoid this check on your cross-filter direction. If you can have it as ‘Both’ then you should be able to go through multiple reference fields to filter your data instead of having a looped relationship.
If this doesn’t work for you, you can always duplicate a field and connect it to your relationships. Although this is a great workaround, it should be used wisely as doing it a lot of times can slow down your Report file.
Walkthrough
In this portion of the blog, we will go through a quick walkthrough of creating a relationship. To do this we will do two different methods that are common in Power BI. In both examples we will be attaching a date column from a sales query to a date dimension. The first will be using the manage relationships button in the modeling tab on your ribbon. The second will be using the Model page on the left side of your screen. Finally, we will go through a quick way of organizing your relationships within the model page (Optional).
No Relationships (Optional)
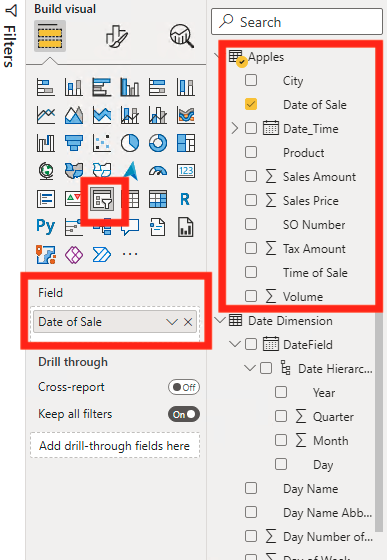
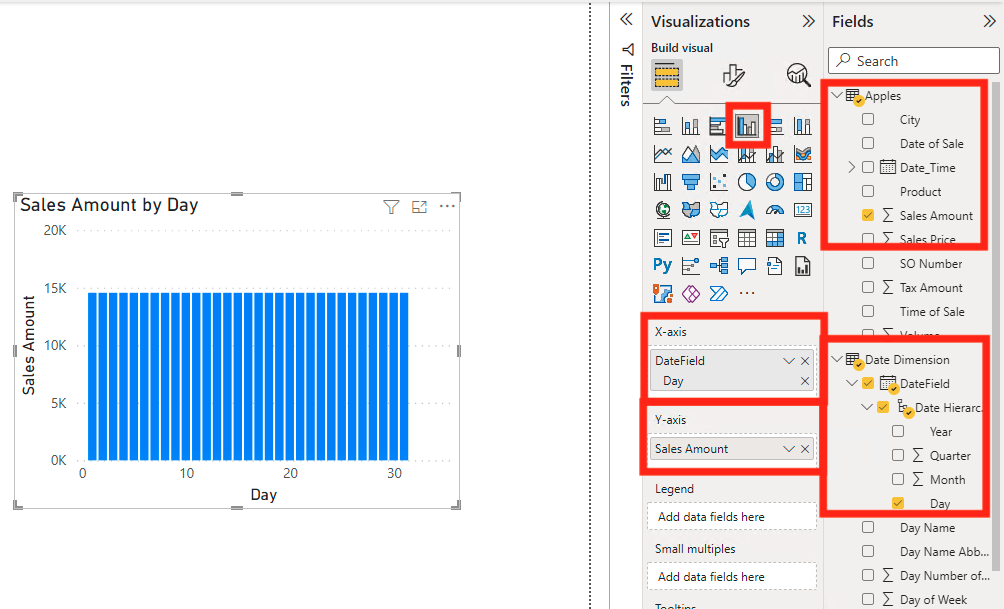
First, we are going to build a visual that doesn’t have a relationship connecting the two queries. We are going to build a slicer with our Date field from the sales table attached, then we are going to build a simple graph that contains data from both the Sales Field and the Date Dimension.
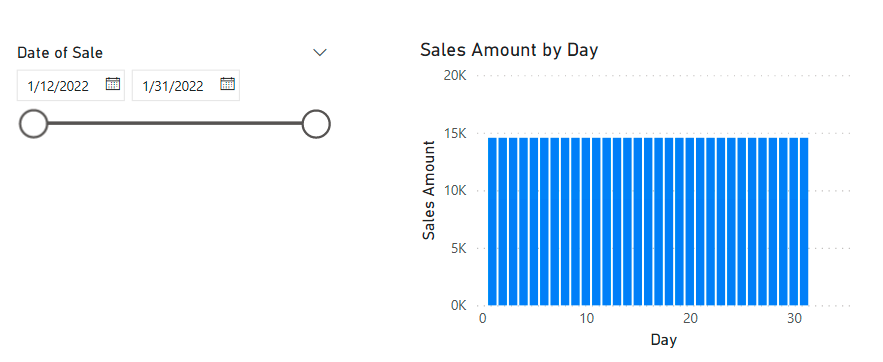
If I click on one of the dates in the slicer, the information in the graph won’t change because the date column from the sales table and the date column from the date dimension are not connected. You can also see in the third image that all of the amounts are the same.
Example 1
In this first example we will be building the relationship in the manage relationships box on the modeling tab. This is many report builders’ preference as you can easily see all your relationships without staring at long lines.
First, we are going to access the manage relationships button. Click on the modeling tab on the ribbon, then click on manage relationships.
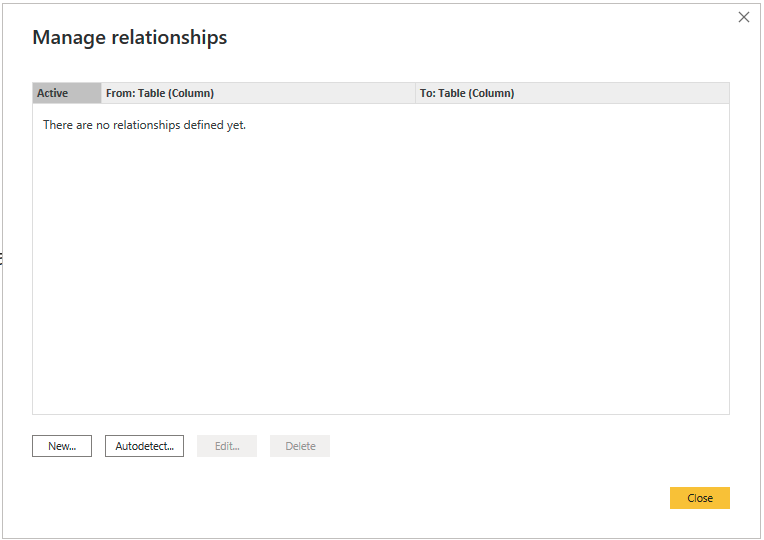
Now you will see the Manage relationships window pop out. If there are no relationships yet your box should only say “There are no relationships defined yet”, but if there are relationships, they will show up inside of that box. You can also see that there is a “Auto Detect” button on the bottom of the pop out. We will not be using this function in the examples, but to learn what it is and how to use it look at the Auto Detect header in the When to Use It section above.
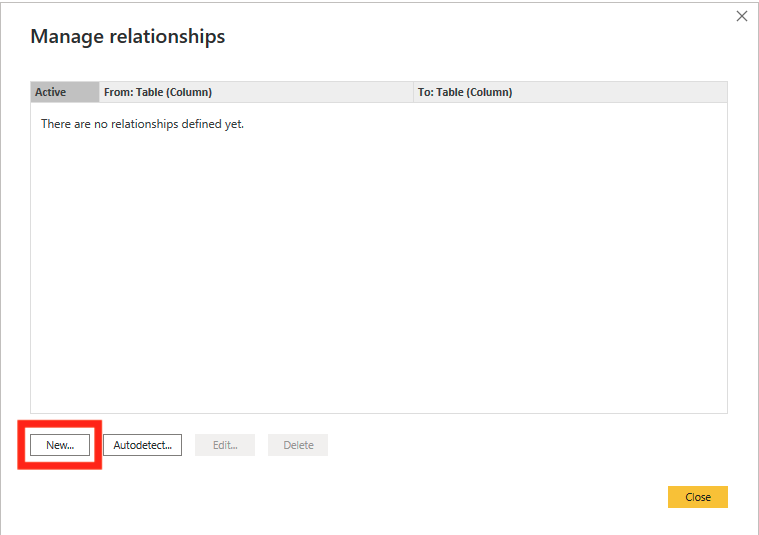
Now we are going to click on New.
This will bring up the Create Relationship pop-out. In this pop-out you will see a very blank window.
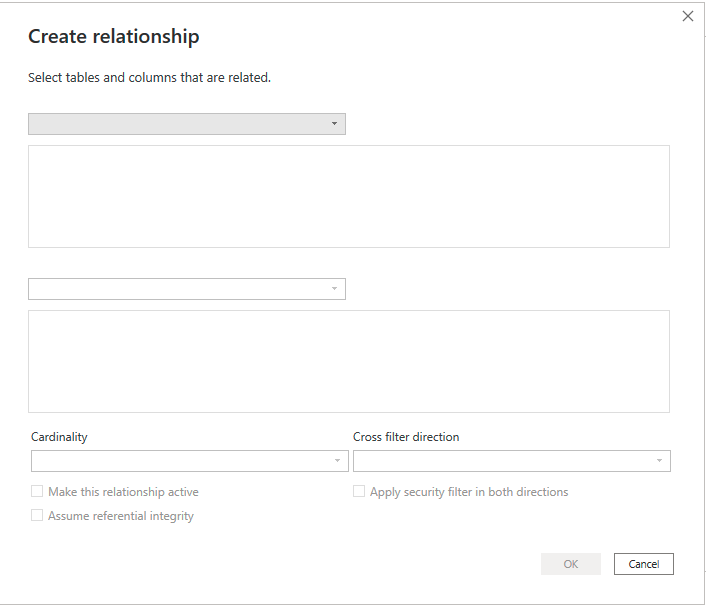
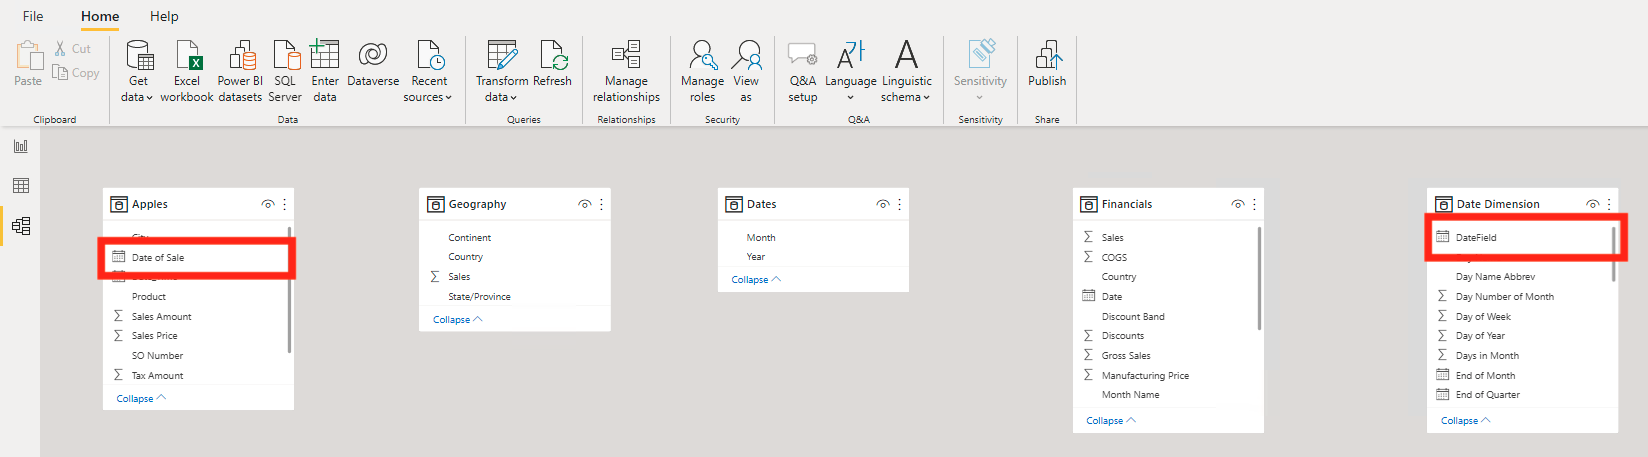
In this you can choose which fields, which columns, Cardinality, and Cross Filtering. We are going to choose the ‘Apples” field and the ‘Date Dimension’ Field.
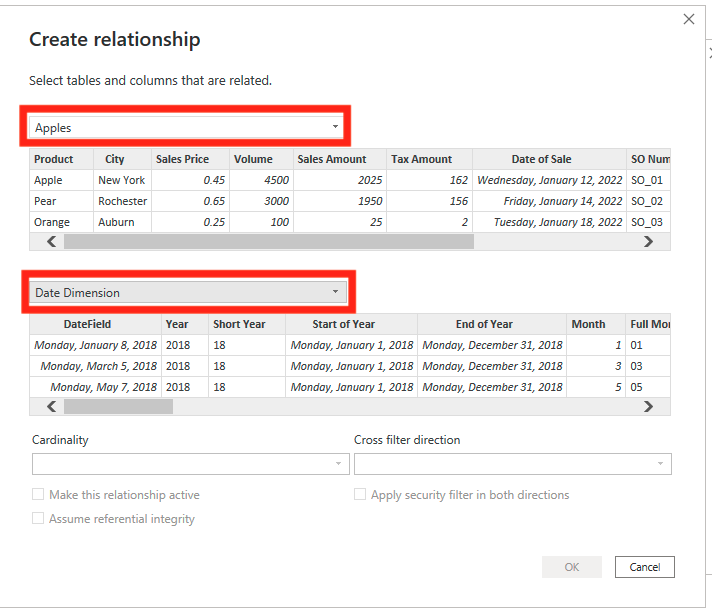
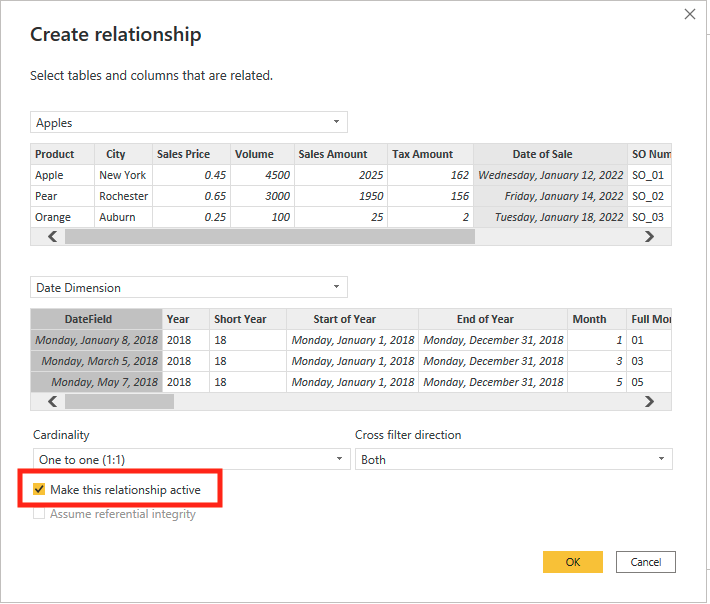
Sometimes Power BI Desktop will automatically choose the corresponding columns for you, but in this case it didn’t. All we need to do is click on the columns that match and we want the relationship to be built on. For this example, I am choosing the Apples [Date of Sale] and Date Dimension [DateField]. Notice that the Cardinality and Cross Filter Direction were automatically updated to what Power BI suggests. Most of the time this is correct. To learn more about Cardinality look at Many to Many Relationships above.

Notice that there is an option to make the relationship inactive. Generally, if you are building the relationship for a graph you will want to leave this activated, but you are able to change this easily late on so if you do want to deactivate the relationship feel free.
Now you can click OK.
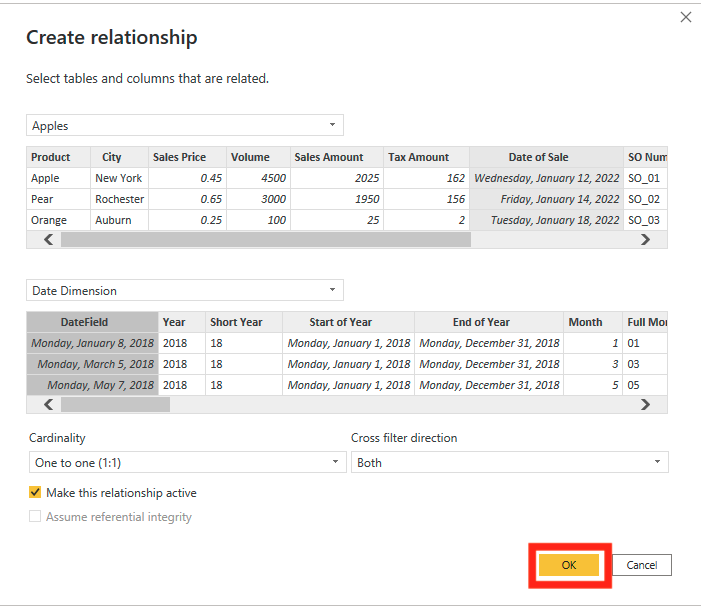
After doing this you will be sent back to the Manage Relationships Page. To get more information on what you are seeing look at the Manage Relationships Pop-Out Page above in When to Use It.
If this is the only relationship you are building (It is for this example), then you can click on Close

Now if you change a setting on the slicer that we built, you will see the graph also change. This is because of the relationship that we built.

Example 2
For this next example we will be using the model page to build our relationship. I like to use this page when reading the manage relationships pop-out gets confusing and in-depth. The downfalls are that this page can get very complicated and very large. Generally, as your semantic models get larger, the complexity of the model page grows. For this reason, I suggest using the manage relationships button from the first example over the model page, but it all comes down to preference.
First, click on the Model page on the left-hand side of your window.
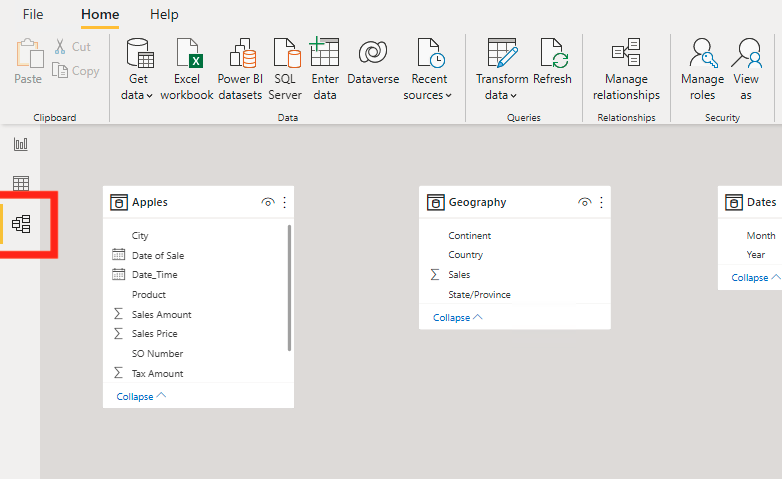
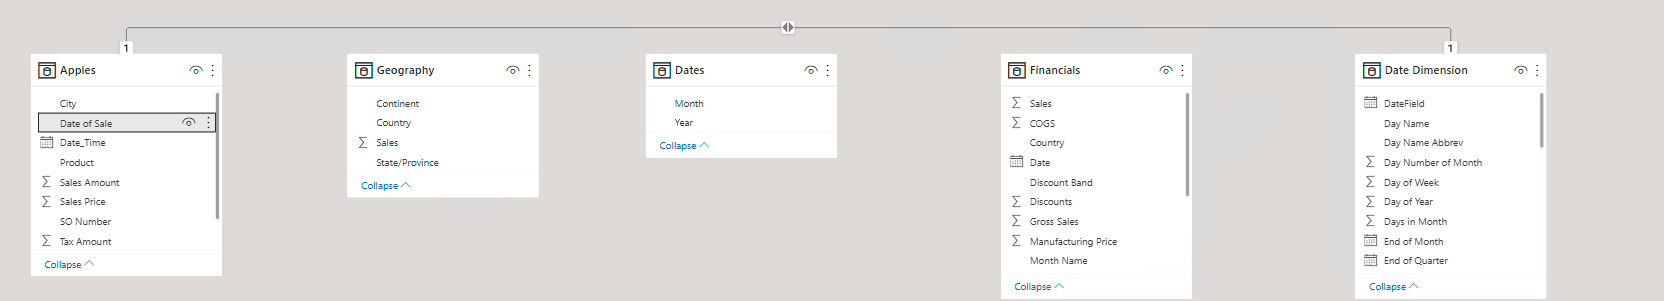
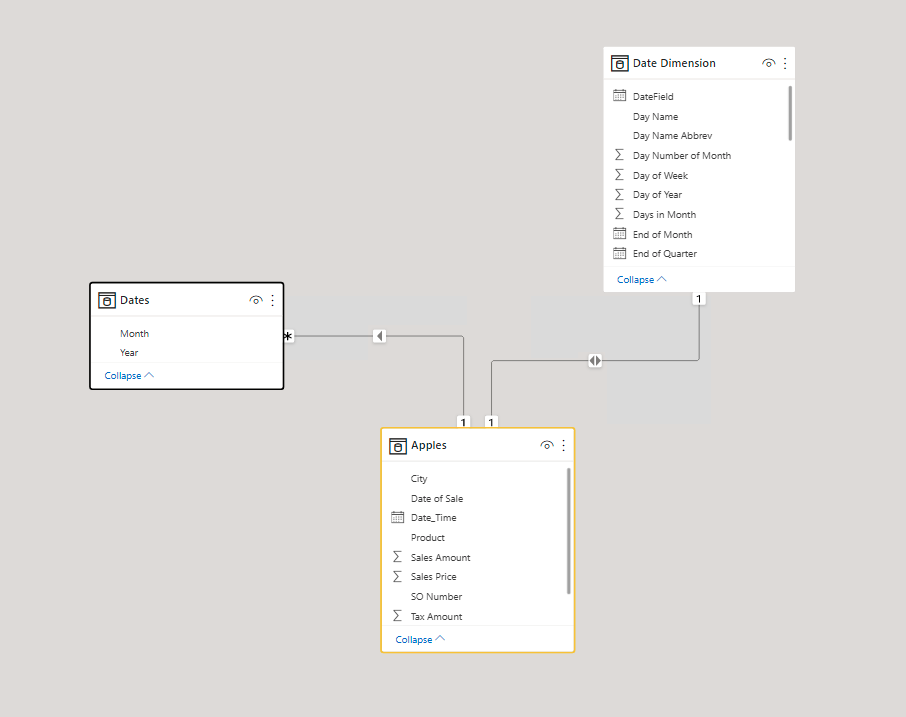
Now you will see a lot of boxes with fields in them. To build relationships with these all you need to do is drag and drop. For our example I will be dragging Apples [Date of Sale] and dropping it on top of Date Dimension [DateField].
Now you will get a line connecting the two fields. This line indicates that there is a relationship between the two fields. The ‘1’ on both the fields represents that the relationship is a One-to-One relationship. The <> in the line represents that the cross-filter direction is both. Notice that all the information we saw with Manage Relationships and Create Relationships Pop-Outs are represented.
If you double click on this line, it will show the Edit Relationships box. This pop-out represents all the data that connects the two fields.

After returning to the dashboard page, if you change a setting on the slicer that we built, you will see the graph also change. This is because of the relationship that we built.
Organizing Model Page
This portion is entirely optional and not required. There are many ways of organizing your model page and the most important aspect is that you understand it. The goal of organizing the model page in the way I will show you is that other people will be able to easily understand it.
This method of organizing your data is called the Collie Layout Method. What it does is have the look up tables above the main table that you will be focusing on. So, all the information flows down to the main table
There are many other great ways of organizing your relationships in Power BI Desktop. This is just the most generally known way because it it is similar to the way people learned from Microsoft Excel.
Comments
6 Responses to “ Power BI Basic Relationship Building ”
[…] Now we will go through an example of attaching all three of the walkthroughs to a Date Dimension that will allow you to build relationships between different queries in your data. If you do not already have a Date Dimension, follow the hyperlink to another EPM blog about date dimensions. There is also an EPM blog on Basic Relationship Building in Power BI. […]
[…] We want to have these specific columns because they allow for the information to have relationships easily. One of the key traits of Power BI Desktop is the ability to relate two different fields (Tables) and display the information in ways that the original table couldn’t do. If you want to learn more about relationships, you can read this EPM Blog on Power BI Basic Relationship Building. […]
[…] Now you can upload your table to Power BI Desktop. Then we will create a relationship between your new RLS page and fact table using the Employee ID field. To learn more about relationships you can read this EPM Blog, Power BI Basic Relationship Building. […]
[…] Power BI Basic Relationship Building […]
[…] Basic Relationship Building in Power BI […]
[…] Basic Relationship Building […]
Leave a Reply
You must be logged in to post a comment.