Power BI – Gif as a Tooltip
By: David Rohlfs
Introduction
Using a tooltip is a great way to add important information to your Power BI report, but what if you want to add instructions or videos to your report? There is a way to add a .gif file as a tooltip to your report and this has a lot of potential for opportunities!
In this blog we will go over when to use a .gif as a tooltip and a walkthrough demonstrating how to insert a .gif into your report.
When to use it
There are endless possibilities because you should and should not use a .gif file as your tooltip! So, this section will not cover all the reasons why and why not to do this, but it will give a few scenarios where I see this process being helpful and hurtful.
Why to use a .gif as a tooltip:
- When you want to describe how to use a page. This is the main way that I see this feature being used because you can create a .gif that shows how to use drill down, drill through, slicers, highlight data, etc.
- As a fun way to show static data. If your data will not be updated and is considered static, then using a .gif video can be a fun way to emphasize important ideas with your data.
- To help describe the data story. You could use this feature to point out other visuals that are helpful to describe the visual.
Why not to use a .gif as a tooltip:
- The biggest reason to not use this feature is because you won’t be able to see the default tooltip if you do this. This means that if you need to show pertinent information in your report you should not rely on the tooltips.
- A .gif does not update dynamically with your report. If you are using data in your .gif, it will not update with your report automatically, so a tooltip is not a good way to show data.
- When your page is already overcrowded and busy. If you have a busy page, adding a .gif as a tooltip is an easy way to take away from your report because it is a lot of movement and can be distracting.
Walkthrough
For this walkthrough I have already created a .gif file to add to my report. There are lots of ways to do this and we will only be covering how to add this file to a report. Also, because this blog will only include screenshots, you will just have to take my word that the tooltip is a moving .gif and not a screenshot. But I promise that this works with my demo.
Creating a .gif file as a tool tip is different from the normal process in that we are not pulling the .gif into the page but making the background into a .gif file. This will make more sense in just a minute.
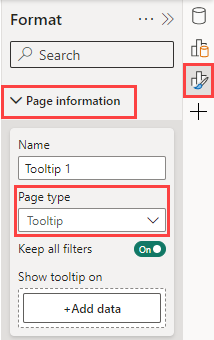
To start, we are going to create a new page in Power BI. You can name this something like Tooltip 1.
![]()
Next, we can click on the background and go to the page format settings. In here we are going to make the page into a tooltip under the Page Type.
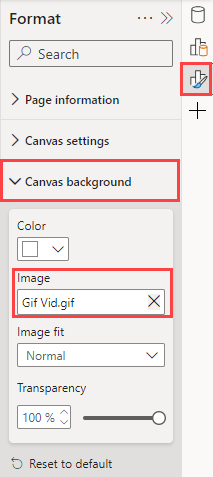
Now we can add the .gif into our page. We are going to go to the Canvas Background and import the .gif file into the image spot.
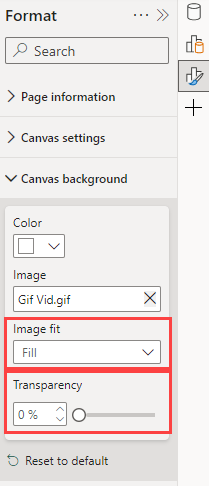
Let’s change the transparency on the canvas background to be 100%. When you do this the background should turn into your .gif video. You will also need to set your Image Fit to Fill.
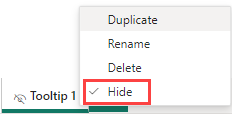
Because this page is only meant to be a tooltip, make sure that you hide the page.
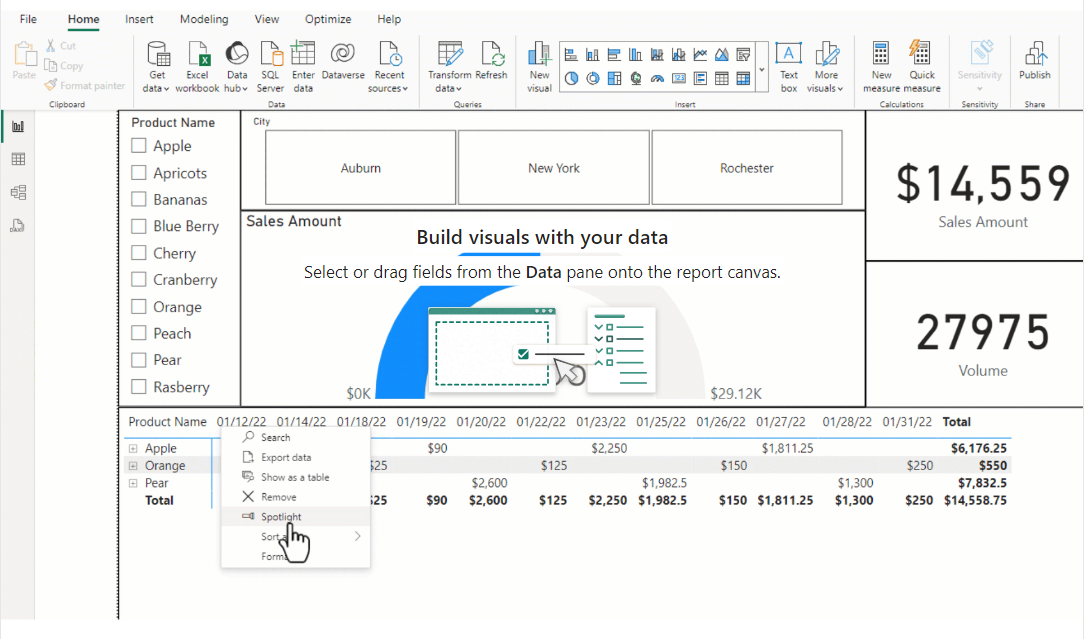
Now we can go back to our main reporting page that has our visuals and apply this tooltip. Start by selecting the visual that you want the .gif tooltip for, then go to the Format Pane, Properties, and turn on the tooltips.
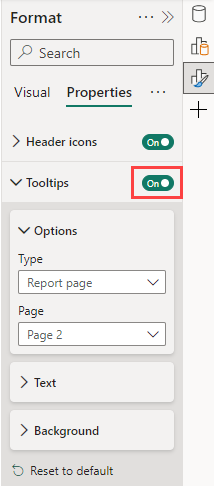
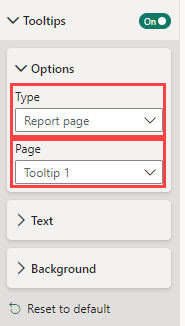
Next open up the Tooltips section and under the options change the type to Report Page, and the Page to Tooltip 1.
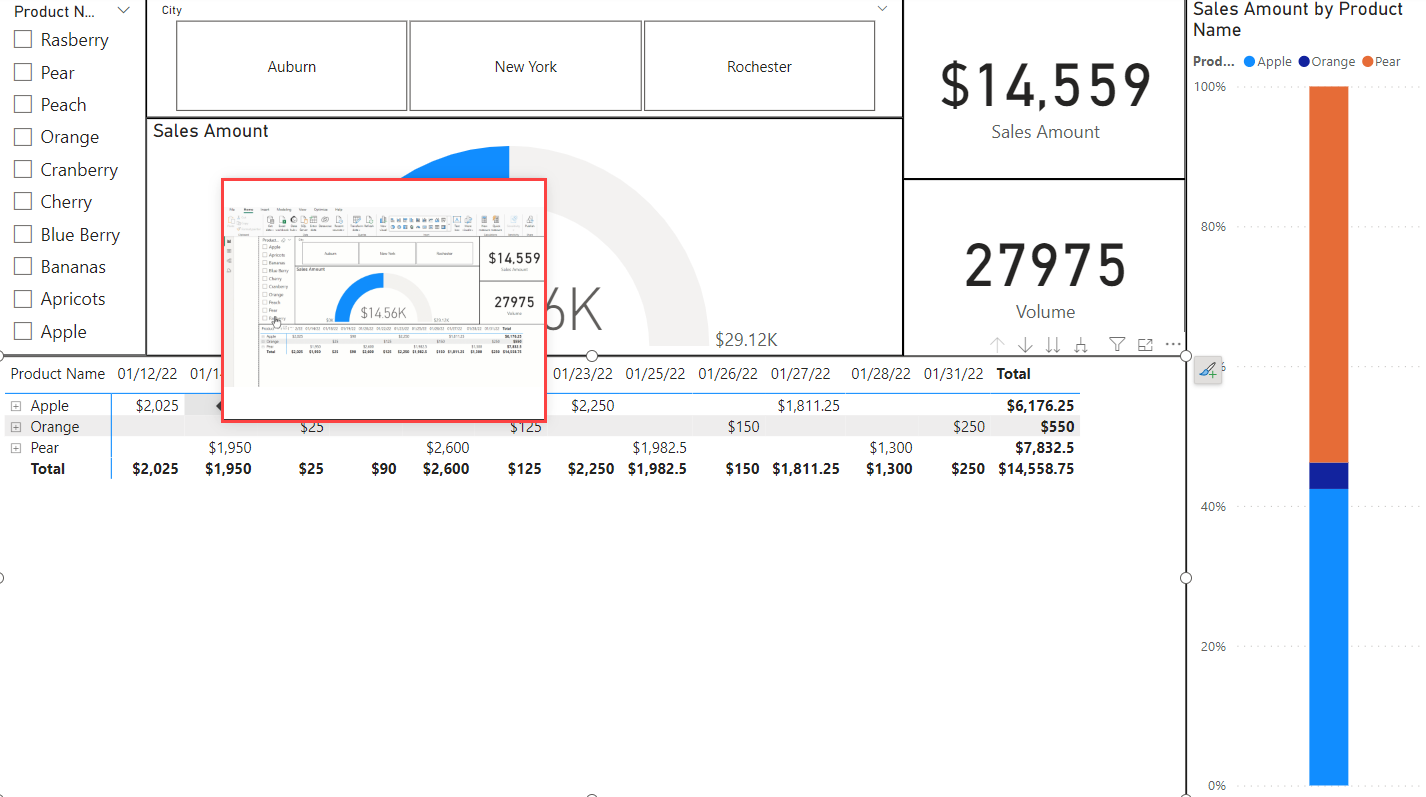
Finally, we need to test that everything worked. Hover over your visual and see that you have a .gif as your tooltip.
Conclusion
While using a .gif as a tooltip can be an easy way to help new report end users, it is also a way to distract end users. So, if you choose to use this, I highly recommend that you do this with caution and first try to educate your end users on the report that you have built. There are many other ways to achieve a similar goal by using bookmarks and text boxes. But I do hope that you find some new and exciting ways to incorporate a .gif into your report development! If you enjoyed this blog, you should check out some of EPM Strategy’s other blogs on tooltips and similar features in Microsoft Power BI.
Links to Related Blogs
Comments
Leave a Reply
You must be logged in to post a comment.