Power BI Drill Through
BY: David Rohlfs
Introduction
One of the harder elements of creating a report for someone is getting all the information on the page that you need. Unfortunately, there isn’t a great way to solve the issue of space unless you make your tiles smaller, but you can use other methods to utilize space that is not on that page. One of the methods that does this is drill throughs.
This blog will go through when to use a drill through and a short walkthrough of how to build a drill through.
When to use it
Drill Throughs are normally used when you want to relate one visual to a subsequent visual. You use a drill through by connecting two visuals on separate pages by their common field, allowing the end user to access more information with the same information.
In the past I have used drill throughs to relate visuals between location, time, volume, amount, and date. While using drill throughs on text is the most common use for the function, where drill throughs can really shine is with date and times.
If you wanted to have a visual that is focused on dates, you may also need a visual that focuses on time. This is complicated because drilldowns between these fields gets complex and messy, so I suggest using a drill through. With a drill through, you can have the day on the original page, and if your end user wants to see the time of each of those days, they can with the drill through.
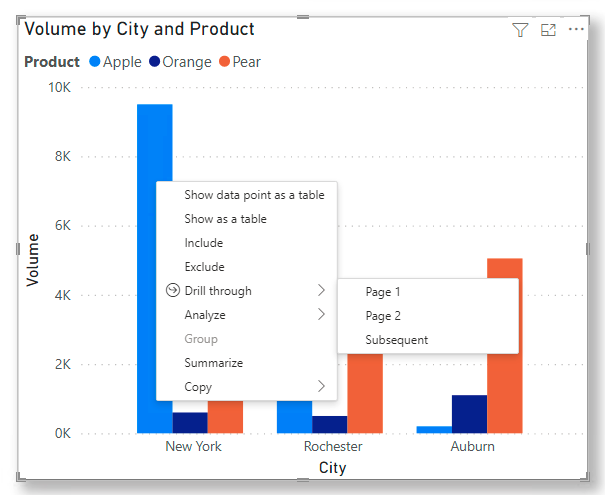
Drill through’s work by selecting a piece of a visual, and either right clicking for the drill through option, or selecting a point on a visual and clicking a drill through button.
If you right click on visual point, you will need to hover over “Drill through” and select the page you are going to.
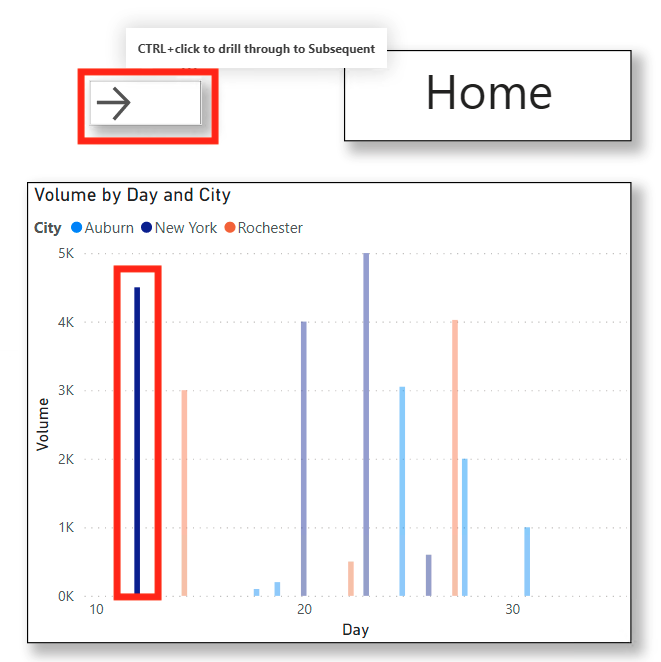
But if you use a button, you just select the point on a visual, and click the button.

Walkthrough
In this walkthrough we are going to go through a quick example of setting up a drill through. Before going through this I would suggest prior knowledge to buttons, but the information is not needed. If you want to learn about how buttons relate to drill through’s,
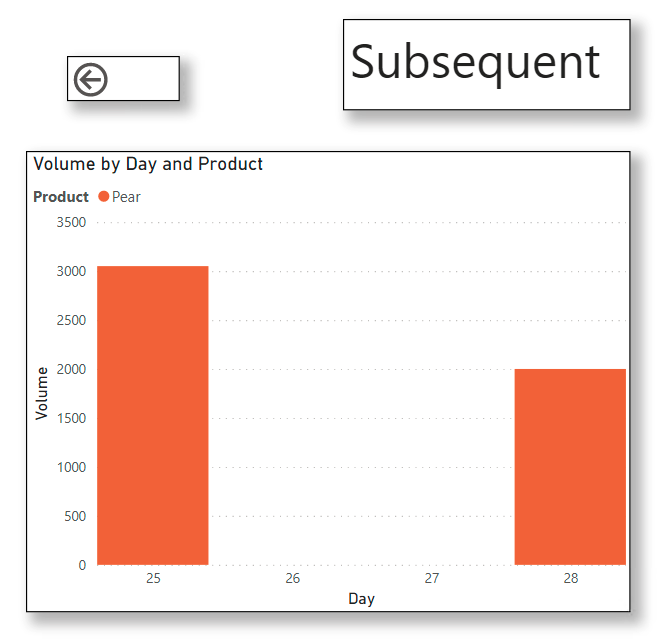
To start I have set up a home page and subsequent page. On these pages we have a visual and button. The home page button will be a drill through button. The subsequent page button will be a page navigation back to the home page. In both page’s visuals, the field that stays the same is the “City”, so we will use that to drill down.
First, we are going to use our common field in the box that says, “Add drill-through fields here”. We are going to do this for the visual on the home page and subsequent page. Before going through this I would suggest prior knowledge to buttons, but that is not required. If you want to learn about how buttons relate to drill through’s, read this EPM Blog.

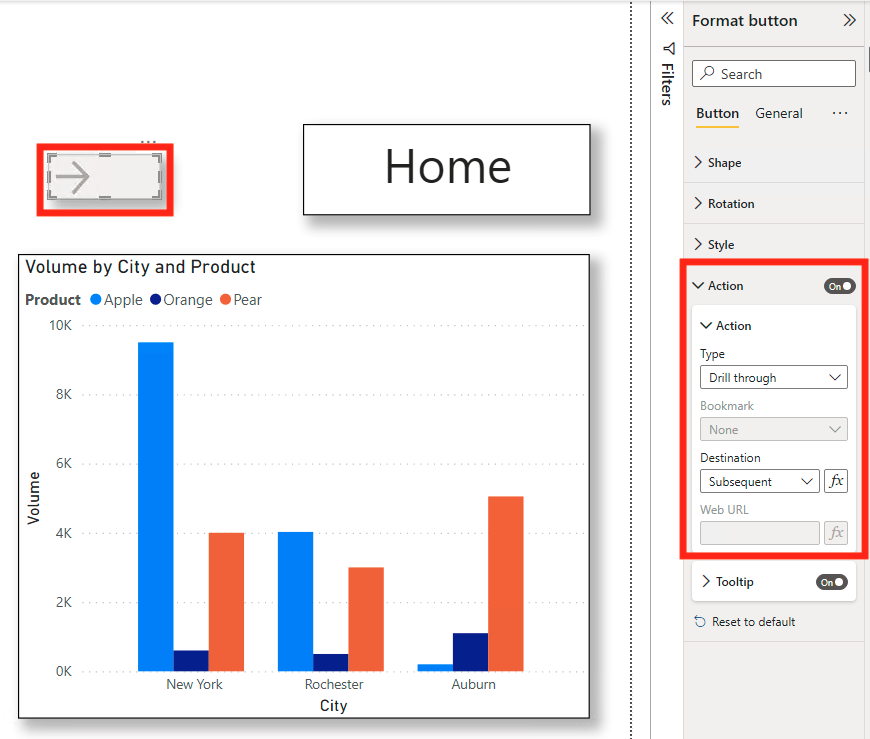
Now if we want to format our button, select the button and go to Action. Your Type should be Drill through, and the destination should be your subsequent page.
To use this drill through with the button, select the field that you want to drill through on, then click on the button.
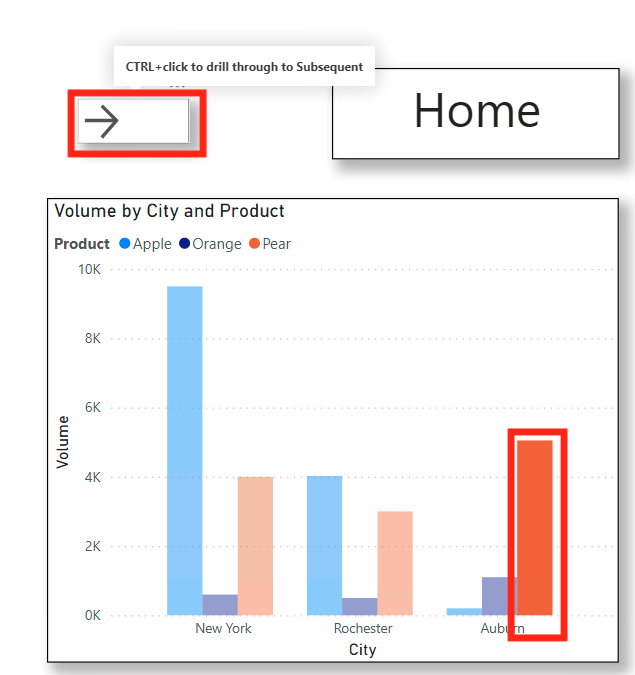
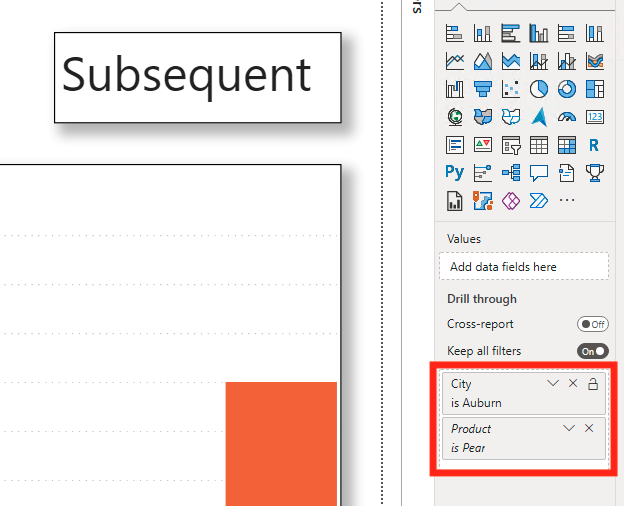
Notice that there are filters added when you drill through after selecting the data point.
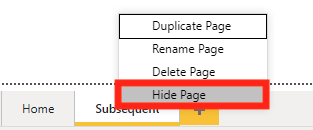
Once you have ensured that your drill through works, I suggest hiding your subsequent page.
Conclusion
Using a drill through is very simple and can add more layers to a report. When you are demonstrating this to an end user, this function often creates a “Wow” moment and demonstrates the abilities that you have with a report. Because of the access that drill throughs allow, a report builder can create depth in a report and expand from a simple concept to something that contains valuable information.
Comments
One Response to “ Power BI Drill Through ”
[…] To learn about Drill Throughs, you can read this EPM Strategy Blog […]
Leave a Reply
You must be logged in to post a comment.