Power BI – Group By All Rows
By: David Rohlfs
Introduction
When you are trying to clean your data, there are always obstacles and challenges. And because of this it is important to learn different methods of how to work with your data. If you clicked on this blog, you probably already know how to use the group by function, but if you don’t, I highly recommend that you read through EPM Strategy’s blog on the Group By Function linked below. This blog is going to focus on only the all rows aggregation of the group by, so it will not be covering some of the basics.
In this blog, we will go over when to use the all rows aggregation in the Group By function, some problems that you may find when working with this function, and a walkthrough demonstrating how Group By All Rows works.
When to use it
The Group By All Rows function is different from the other Group By aggregations in that it allows you to keep your parent table. If you are familiar with the group by function, you will know that you often need to use a group by in a duplicated table or only for temporary reasons. But the Group By All Rows changes this.
A reason that you may choose to use this function is to create a dimension table from a fact table. This is possible because you can group by a column inside of a fact table and select a list of fields from the all rows column.
Common Problems
It is easy to get an error when you start using the all rows group by aggregation. This is because you are trying to expand a set of values that are connected from a single value. So, all the values inside of a field may not be the same. Here is an example of this:
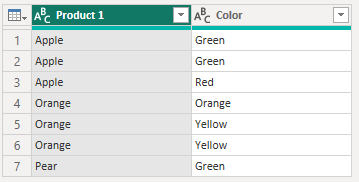
When you go through this process here are the before and after images
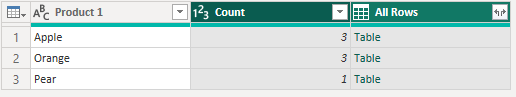
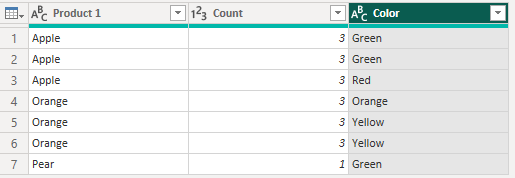
You can see that our count aggregation stays the same even after we expand the all rows column. This has a lot of beneficial outcomes, but you should recognize that the aggregation is on the entire field and is not dynamic to subsequent steps added.
Walkthrough
In this walkthrough we are going to do a simple example that is only to demonstrate the capabilities of the all rows aggregation.
To start we need to select the query we will be working on, then click on the transform ribbon, and select group by.

Now we can choose the row or rows that we want to group by and the aggregations that we want. I am going to place in a sum aggregation as well as an all rows aggregation. Notice that I need to use the advanced group by option.
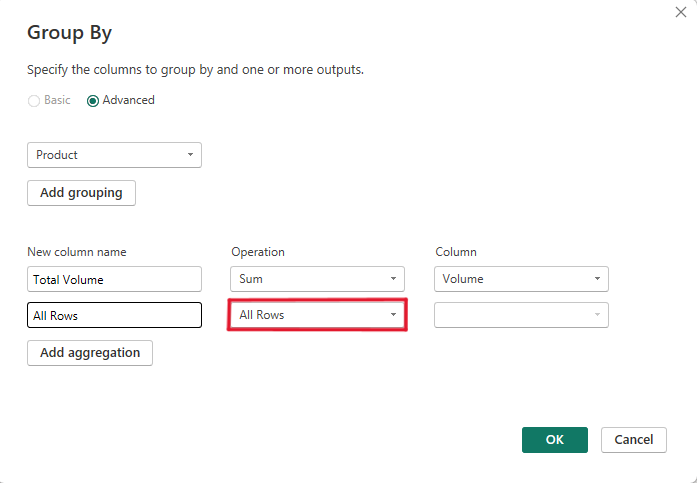
Now we can click ok in the bottom right corner, and you should get a table like this:
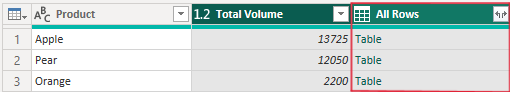
You can see that the all rows column has a TABLE in each cell and the column header has an expand icon. For this demonstration we are going to expand a couple of the columns.

Conclusion
While using Group By All Rows is important to know, it is also a fairly niche use function in Power BI. But when you have a situation that can use the Group By All Rows aggregation, it can be extremely useful and time saving. If you liked this blog, I suggest reading through some of the linked blogs below.
Links to Related Articles:
Comments
Leave a Reply
You must be logged in to post a comment.