Power BI and Group BY
BY: David Rohlfs
Introduction
One of the best things about Power BI is that there are almost always multiple ways to do everything! One of the functions that I have learned to enjoy is Group By. Group By has many different uses and can be very helpful when you get stuck.
Like many functions in Power BI, Group By serves for some of the same solutions that can be created in other ways. This is not to say not to learn it, but there may be a better method that you can find to complete the same problems while avoiding the Group By Function. However, I like the Group By functionality and find it easy to use.
In this blog you will learn of the different uses for Group By and see two examples of how to use the Group By function in Power BI.
Uses
The Group by column includes many uses including:
- Arranging data
- Find duplicated rows
- Count rows
- Sum column amount
- Average column amount
- Find a Median amount in column
- Find Minimum amount in column
- Find Maximum amount in column
- Count Distinct Rows
- Use an All Rows Function
Among the many uses for Group By, the user can also use it to debug or enhance their report.
Walkthrough
In this walkthrough we will show you the basics of the Group By Function and demonstrate two different examples. The examples are of a simple count of a column with the count rows and count distinct rows, and we will do a get a count of 3 columns, and a sum of those columns.
Group By Function Basics
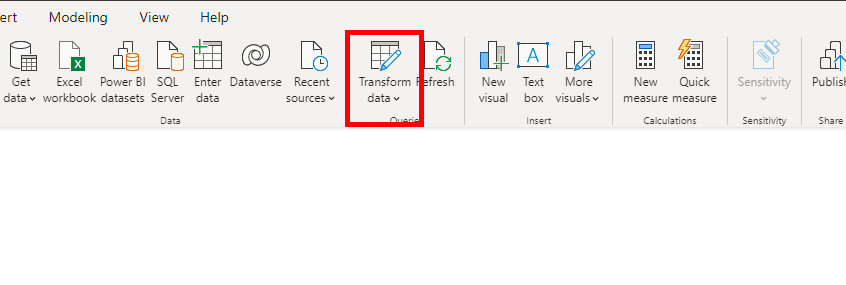
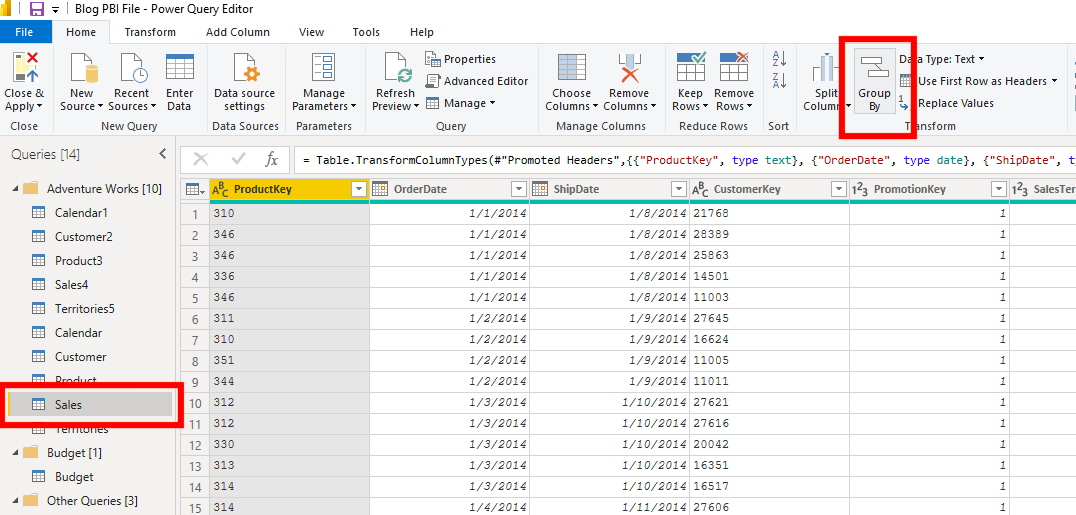
To find the Group By function you first want to go into the query editor, go to the home tab, and click on group by.
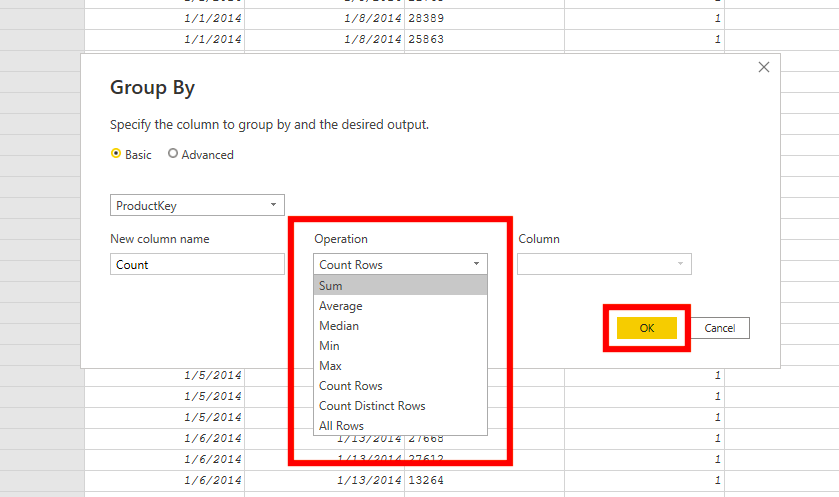
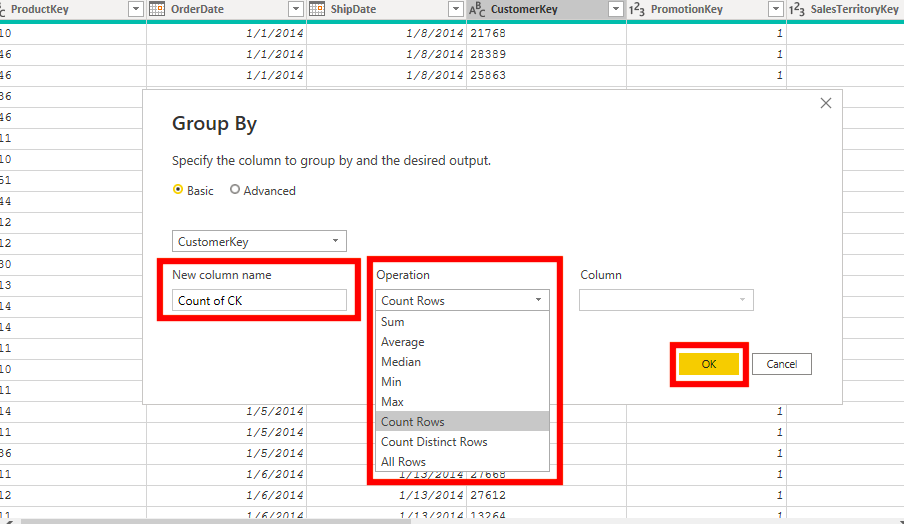
Once you get to the new window, you can choose the column you would like to work on and the aggregation you would like to perform. When you are using certain functions, an option to enter another column will appear; when this happens be sure to enter the second column you would like to use. These are a couple examples demonstrating this capability.
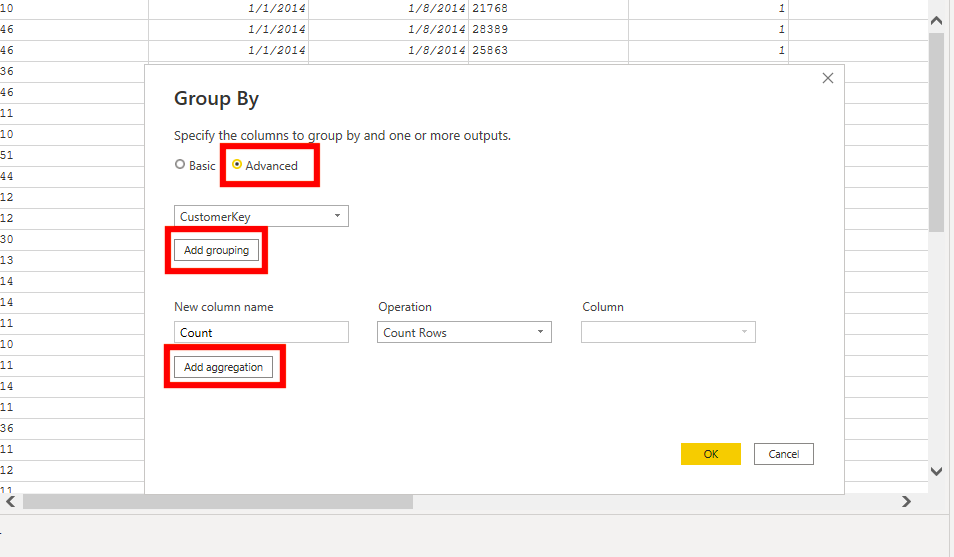
There are other options available on the Group By screen. These options allow to add more columns to use for grouping, or to add more aggregations. You select these options by clicking the Add Grouping or Add Aggregation buttons.
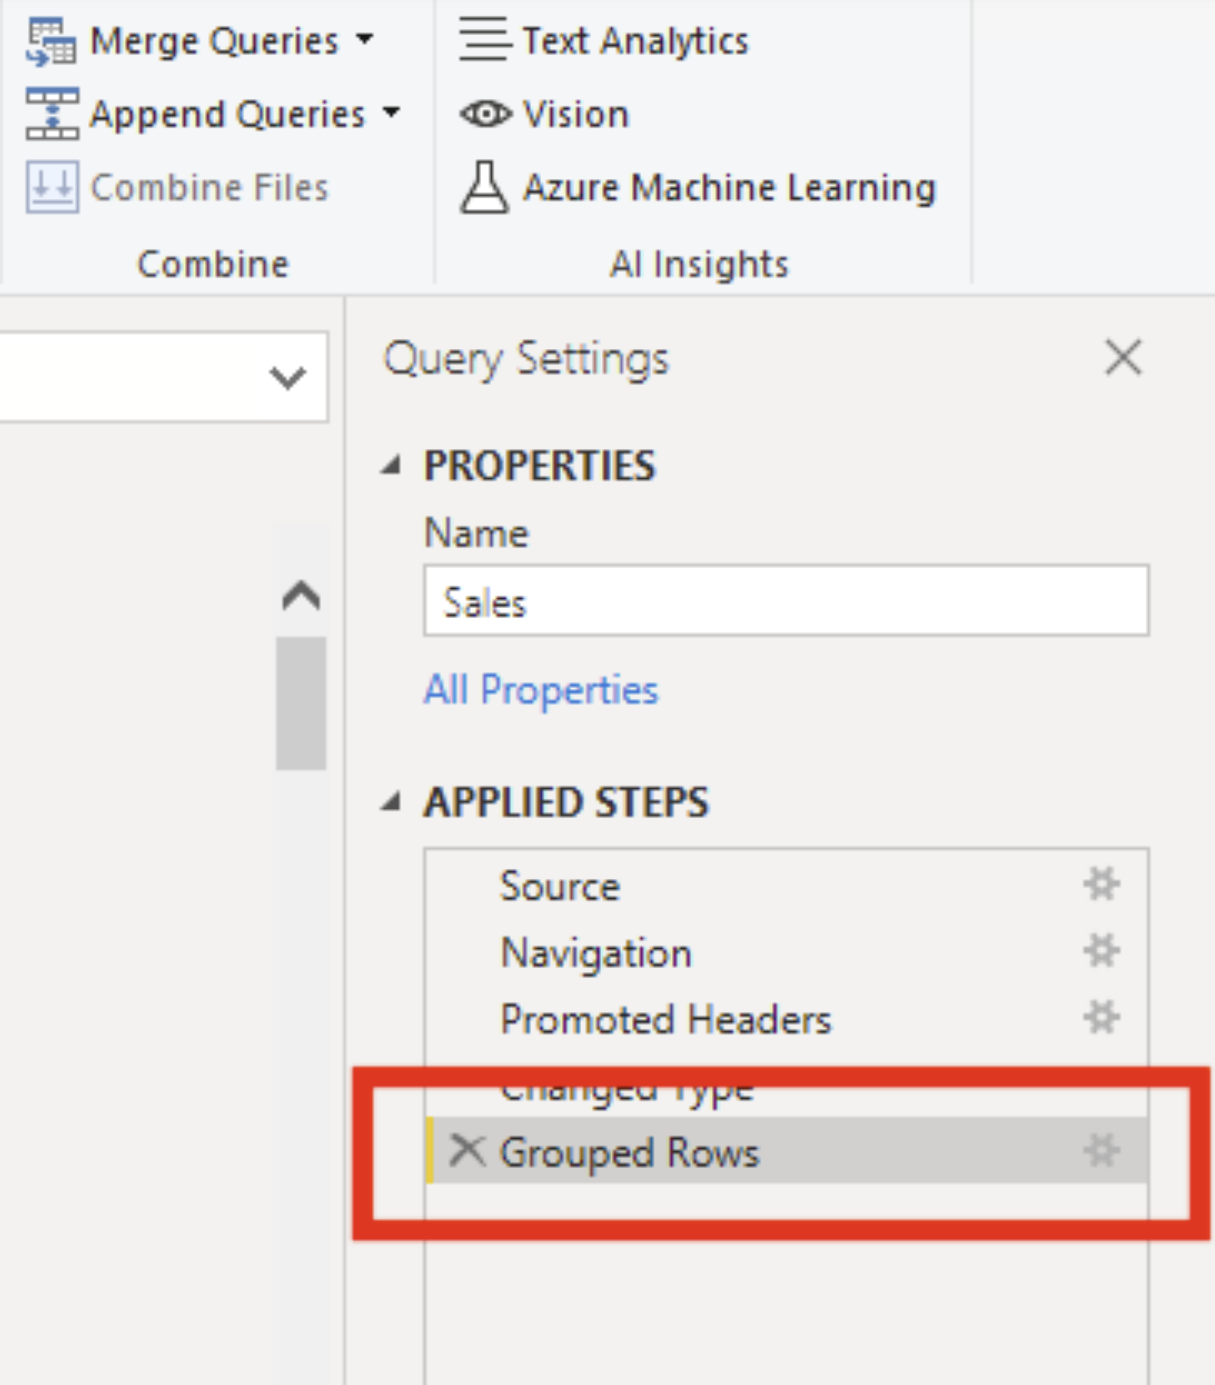
If you are using Group By for testing purposes or if you don’t like your Group By results, take a look at the Applied Steps. The “Group Rows” step is the one representing the Group By function. To remove it, click on the ‘X’ next to it in the Applied Steps to start fresh.
Simple Count Example
This is a very simple example of how to use the Group By function. It will show the reader how to use a simple count, how to interpret the count, and how to go back to the original data. This example is great to debug your data, or to find outliers in your data.
Before you start on this example, be sure to read through the ‘Group by Function Basics’ above. It will help you to see how to start and where we are going with this example.
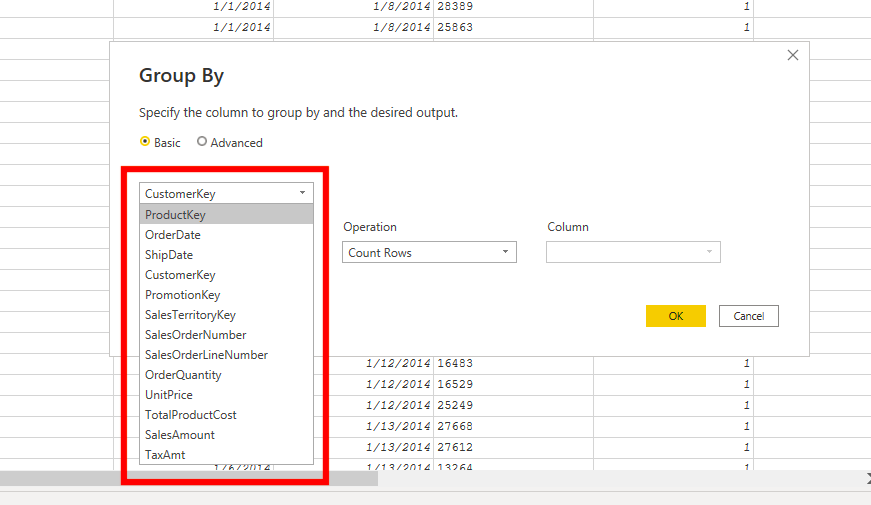
Upon getting to the Group By window pop out, if you do not have the column you would like to change in the dropdown already, select which column you want.
Next, you will want to rename the column in a way that it can reflect both the original column, and the operation you are applying to that column. You will also want to choose the operation that you want applied to that column. Then click OK.
Once you have clicked OK, two columns should pop up. The original should be on the left of the window, while the newly created column should be on the right.
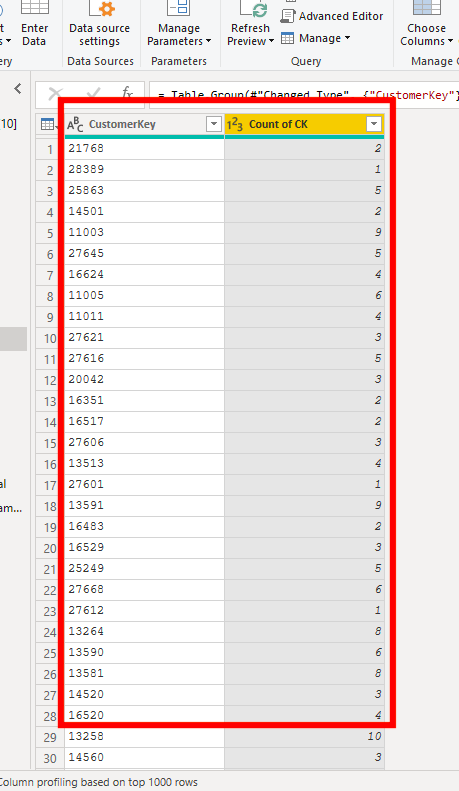
In this example, since we have done a count row, we see how many of each unique ‘Customer Key’ is in the column. This specific example has many uses, it can show how many times identical data shows up in the column, help you filter out certain data, find outliers of data, or help you understand the data you are viewing.
Once you are done viewing this data, if you want to go back to original data, you can click on the ‘X’ in the applied steps next to Grouped Rows. This will discard the changes that you have made in the Power Query and let you go back to your original data.
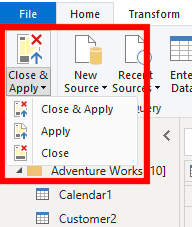
If you used the Group By function and are content with the results and want to use that data for your visualizations, you can do so easily. In top left corner you will see an option to ‘Close and Apply’. If you click the dropdown, you can choose to either ‘Close’, ‘Apply’, or ‘Close and Apply’.
Grouping by 2 or 3 Columns Example
In this example we will be showing you how to use the advance portion of the Group By function. We will be walking through an example of simultaneously counting and summing three different columns in Power BI. As before, this will be done in the Power Query.
Before you start on this example, be sure to read through the ‘Group by Function Basics’ above. It will help you to see how to start and where we are going with this example.
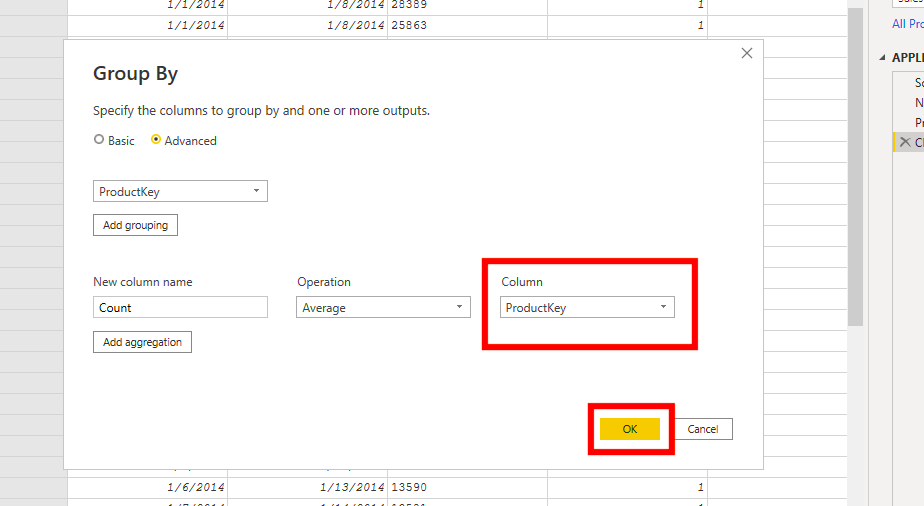
Once you are in the pop out Group By window, click on the advanced option at the top.
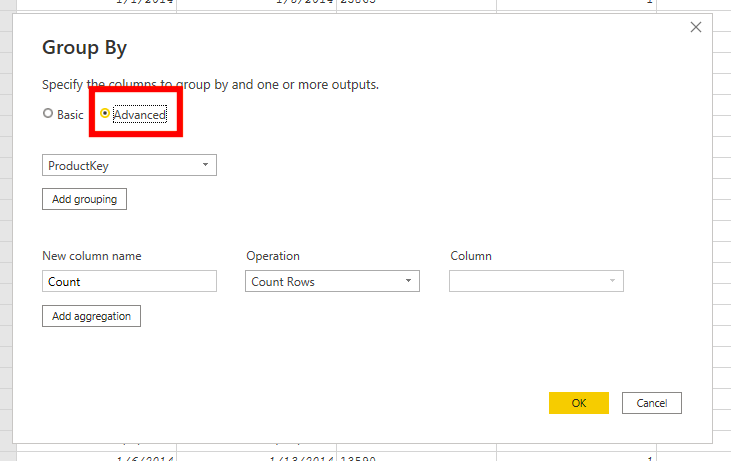
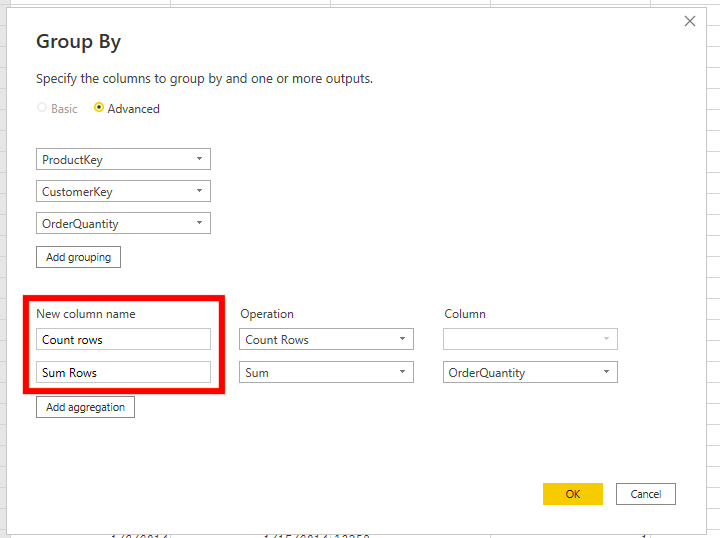
Next you will click on Add Grouping. Then select the columns that you would like to use. We will end up choosing ProductKey, CustomerKey and OrderQuantity columns but for the moment we are just using the same field for the example.
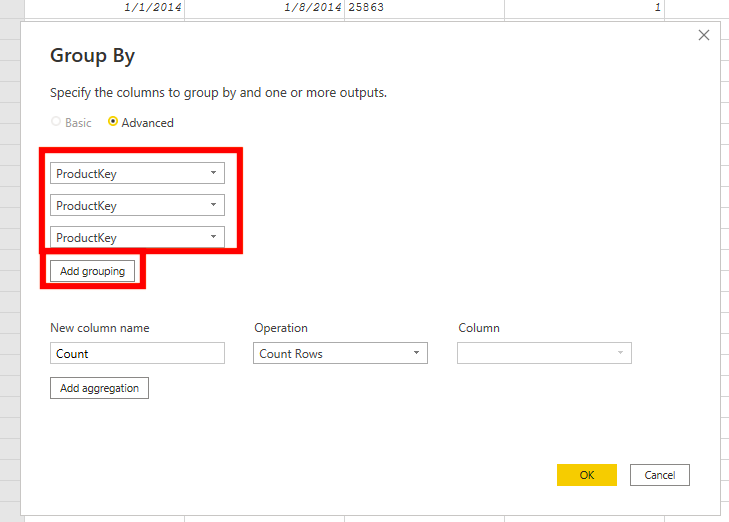
This can be as many columns as you want, and you are able to remove them by clicking on the ellipses to the right of the dropdown and select Delete. You may also choose to move the grouping column up or down in the viewing order. This can be helpful if you have many columns or want to keep them as close to their original order in the data as possible.
Next click on the Add Aggregation. Then select the operations that you would like to use.
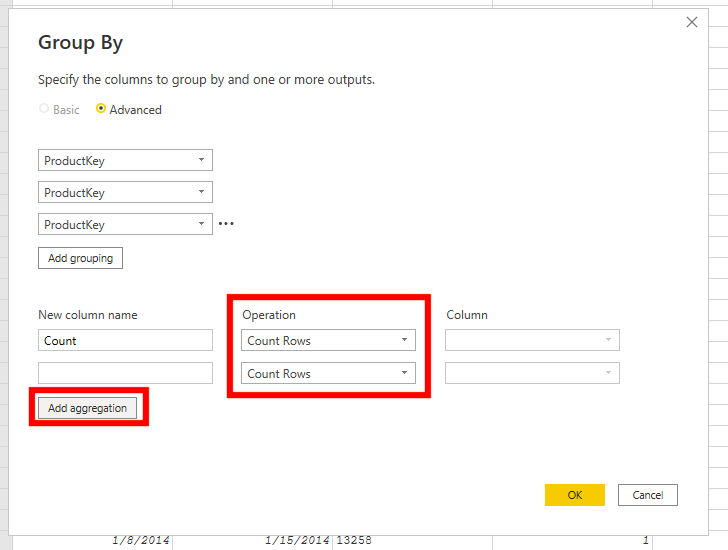
This can be as many operations as you want, and you are able to remove them by clicking on the ellipses to the right of the dropdown and select Delete. You may also choose to move the operation up or down in the viewing order. This can be helpful if you have many operations and want to keep them as close to their original order in the data as possible.
Note: When using some of the operations, you may need to specify which column you would like to use that operation on.
Now you will want to rename the new columns with a name that reflects the original column(s) and the operation used.
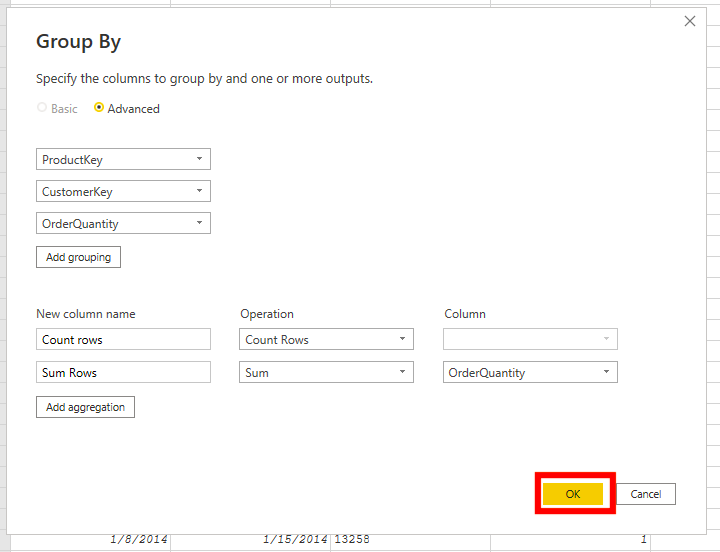
Then Click OK
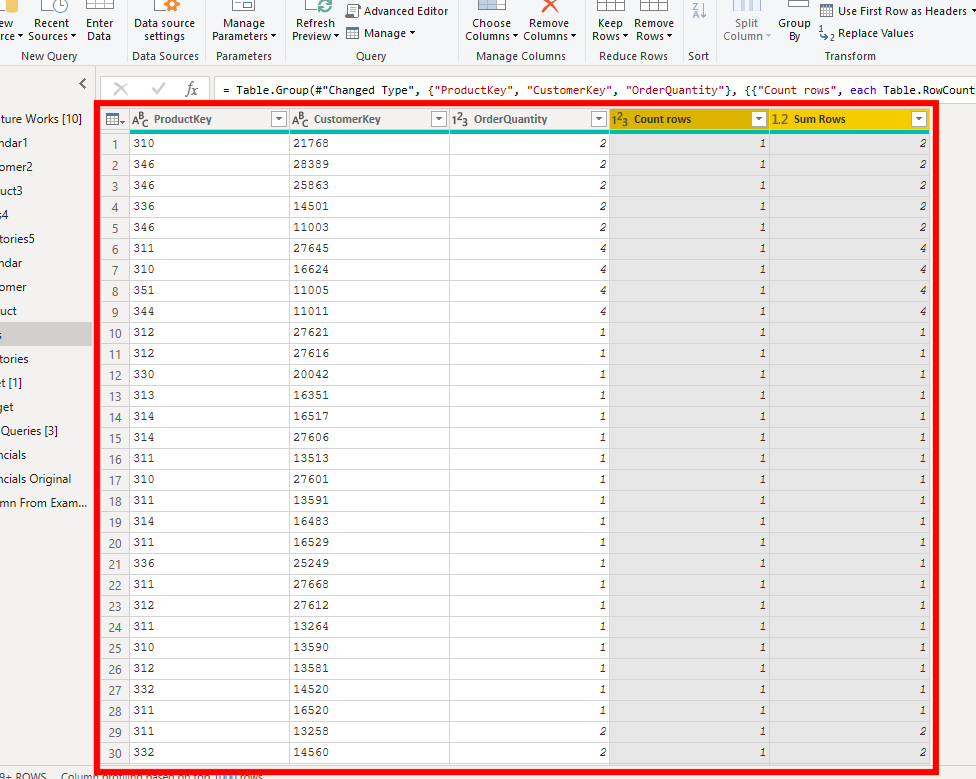
After clicking ok, you will be redirected to a viewing of the original columns and the columns you have just created.
Once you are done viewing this data, if you want to go back to original data, you can click on the ‘X’ in the applied steps next to Grouped Rows. This will discard the changes that you have made in the Power Query and let you go back to your original data.
Once you are finished with your data, in the top left corner you will see an option to ‘Close and Apply’. If you click the dropdown, you can choose to either ‘Close’, ‘Apply’, or ‘Close and Apply’.
Conclusion
The Group By function can be very useful in Power BI because of its capabilities in the Power Query. Group By can be very helpful when trying to find duplicated data, group data, sum data, etc. Like many other functions in Power BI, there are many other ways to solve these problems that you may have or find more convenient ways to form the data how you want it.
Comments
7 Responses to “ Power BI and Group BY ”
[…] This is very easy to use for when you have duplicated rows in your data. If you want to check for duplicated rows look at the EPM Strategy article about Group By […]
[…] Power BI and Group By […]
[…] Power BI and Group BY […]
[…] Power BI and Group BY : :: Welcome To EPM Strategy :: […]
[…] Group BY […]
[…] Group By […]
[…] Group By […]
Leave a Reply
You must be logged in to post a comment.