Power BI Conditional Formatting with DAX
BY: David Rohlfs
Introduction
This blog is going to explain how to use DAX to conditional format cells, with different rules from previous columns. This can become very important when you want to do conditional formatting to a field, but you need to separate the rules by another columns data.
This blog will go through when to use this formula, a common problem associated with this formula, and a walkthrough of how to build and use this formula.
When to use it
The main reason to use DAX as your conditional formatting is because you can filter through other columns. This is very helpful if you want one set of data from a table to have a different set of conditional formatting rules than another set of data. Thus, using DAX allows you to develop row specific conditional formatting.
Common Problems
Reference Field
The field that you base your colors off may not work. Sometimes you need to make that field into a measure or calculate your data from a measure or conditional column. There are many ways to do this using DAX, but they can differ depending on your semantic model so there isn’t just one solution for every semantic model.
Walkthrough
Because this method uses DAX to do our conditional formatting, I am going to use a sample table to demonstrate. At the end of the walkthrough, I will paste a starter formula for you to use.
This method does require some basic knowledge of how to use DAX and visuals in Power BI Desktop.
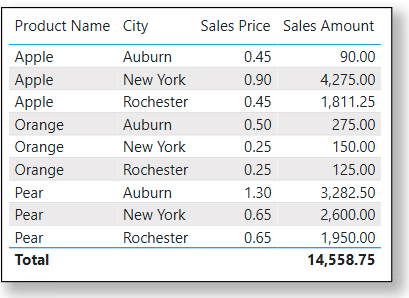
To start, we will need a column that has our values we will be basing our colors from. For me this is going to be the same column that I am using the conditional formatting on. I am going to use my [Sales Amount] column for my colors, and I also want to differ the rules based on my [Product Name]. I am doing this because I know I sell more apples, so I want to have a different rule for that product.
To use my Sales Amount, I need to make that data into a measure first. Because of how my data is set up, I am just doing a sum Formula.
![]()
Once we have determined which fields we want to use, we can start building our formula. I prefer to do this in a different program than Power BI because it is easier to come back to later if I need to alter it. There is a starting formula below if you want to copy the basic formula.
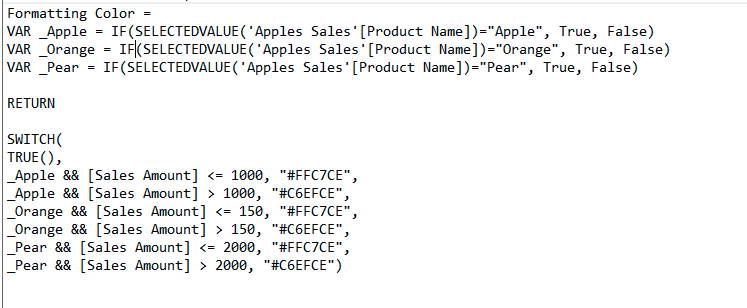
The top portion of this formula, where the VAR are, is separating the data between the cells in the column Product Name. This allows me to use different rules for each of the VAR that I make. The bottom portion of this formula is my rules. I am taking the title I made above for my variances and applying a color to the selected values.
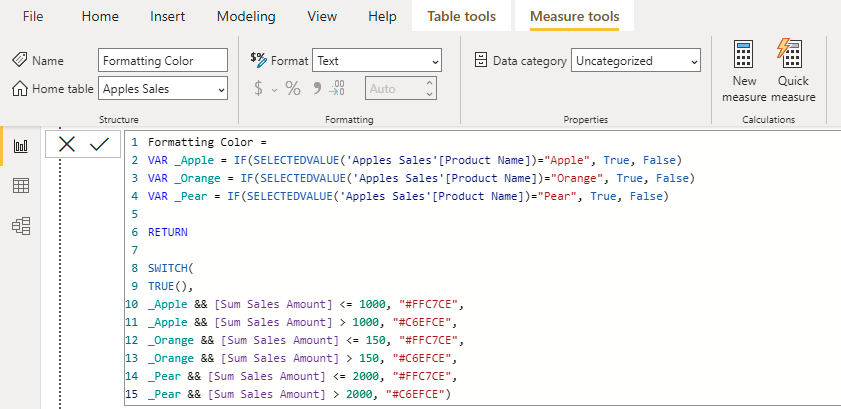
Once we have written our formula, we can put it into a measure. You want this to be a measure because it works better with our conditional formatting function.
Now we can put our original information in a table so that we can see if the conditional formatting works.
To get to the conditional formatting, click on the arrow for your field in the visualizations pane, then click conditional formatting and choose what you want to format. I chose to do my background color.
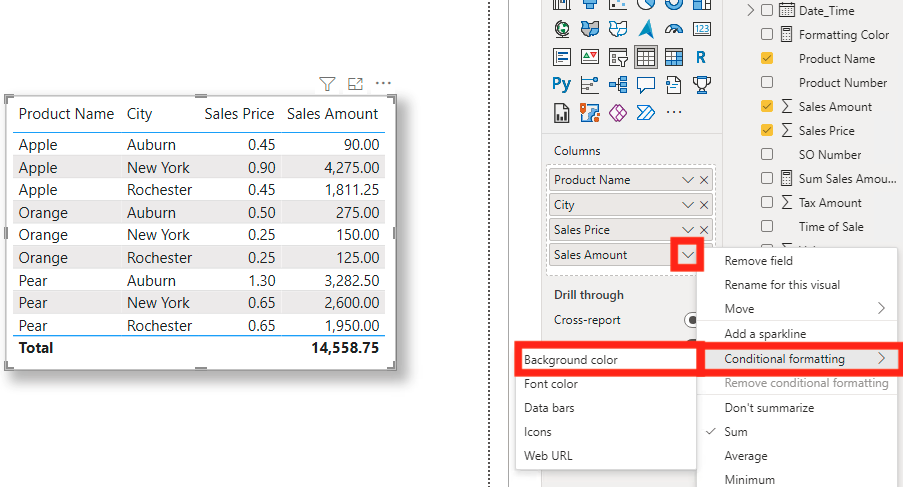
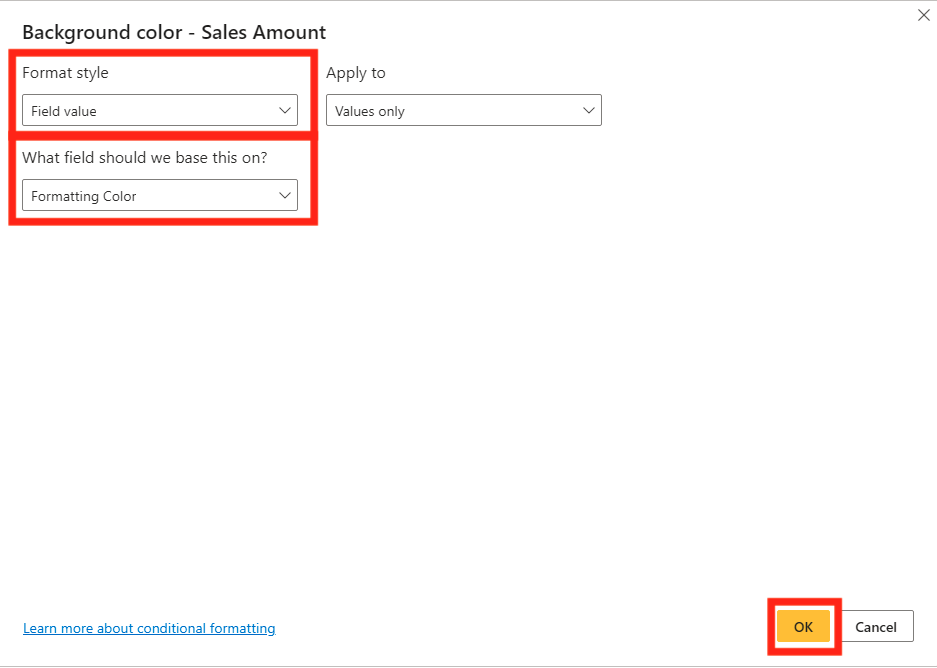
In the pop-out window for conditional formatting, change your Format style to “Field value” and select the measure you wrote for the “What field should we base this on?”. Then click OK.
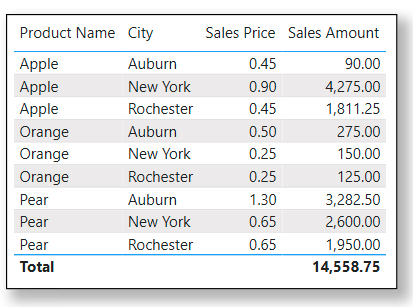
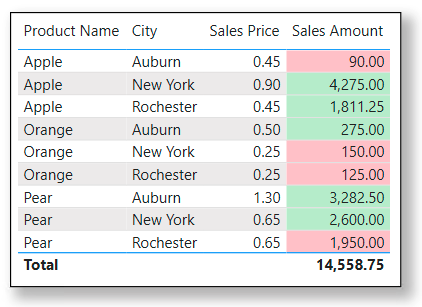
Now your formatting should load into your table. See that my oranges are not reflecting the same rules as my apples or pears.
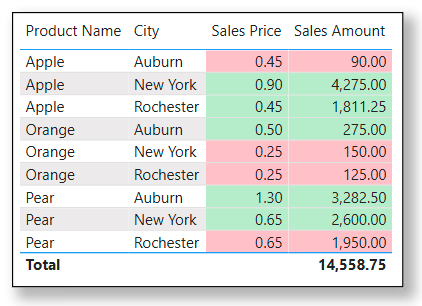
Note: You can base other columns that you did not reference in the formula for your conditional formatting. For instance, I could base my Sales Price on the same formula I made for Sales Amount. The only downside is that without changing the formula, the columns will reflect the same colors.
Here is the base of the formula I used. You will need to replace the TABLE with the table you are using, the FIELD with the field you are basing your rules off, the TYPE with the column that you are using to separate your data between, and the NAME with the cell information that you are separating your rules by. You can also change the numbers in the bottom portion to reflect your rules. For now, all the rules are just “100”, but you can also make them a percentage by using a decimal format. The Color also uses only “#FFF000”, so you will need to alter that to you own preferences. Note that you can copy and paste the pieces of the formula to match your preferences and adjust the formula to your data.
Title =
VAR Name1 = IF(SELECTEDVALUE(‘TABLE'[TYPE]) = “NAME”, True, False)
VAR Name2 = IF(SELECTEDVALUE(‘TABLE'[TYPE]) = “NAME”, True, False)
VAR Name3 = IF(SELECTEDVALUE(‘TABLE'[TYPE]) = “NAME”, True, False)
RETURN
SWITCH(
TRUE(),
Name1 && [FIELD] <= 100, “#FFF000”,
Name1 && [FIELD] <= 100, “#FFF000”,
Name2 && [FIELD] <= 100, “#FFF000”,
Name2 && [FIELD] <= 100, “#FFF000”,
Name3 && [FIELD] <= 100, “#FFF000”,
Name3 && [FIELD] <= 100, “#FFF000”)
Conclusion
Although this method becomes very complicated the first time that you use it, there are a lot of upsides of using DAX to make your conditional formatting. The formula is also built to be easily adjusted to your data and requirements.
Comments
3 Responses to “ Power BI Conditional Formatting with DAX ”
[…] Formatting for Time is very similar to our normal Conditional Formatting Using DAX from a previous EPM Strategy Blog, so this blog will also be describing building a calculated […]
[…] Conditional formatting is very useful if you want to color code your data. What this means is that you can have a whole column one color, apply rules so that certain portions of your data have conditional formatting, or use a measure to develop rules for your data. We are going to focus on the first two examples, but if you want to learn more about conditional formatting through DAX, you can look at EPM Strategy’s blog on Conditional Formatting with DAX. […]
[…] formatting for dates. This blog will build from the knowledge from another EPM Strategy Blog, Conditional Formatting with DAX. The difference from this blog and that one is that we will be going over the use of dates in our […]
Leave a Reply
You must be logged in to post a comment.