Power BI – Pivot in Power Query
By: David Rohlfs
Introduction
Power Query can be hard and difficult to know what function to use and where to use it. While looking through the Microsoft Power BI and Fabric community forum I came across a question that described a situation where the developer wanted to count a text field in an unconventional way. This sounded like a good situation to use a pivot function in Power Query.
In this blog will go over the Pivot function in Power Query and talk about when to use it.
When to use it
The Pivot, Unpivot, and Transpose functions are especially hard for beginners to learn in Power Query. Without being familiar with the transformation that they create it can be hard to see what your query will look like with the function in place. And to be honest, there are a lot of times where you will avoid using these functions unless absolutely necessary if you don’t know how they work. But each of these transformations has a lot of power and potential to be utilized in a report.
The pivot function is a table transformation. This means that it will drastically alter the layout of your table. If you are coming from a SQL based data or data that is in a standard data form, you might never need to use a function like pivot. But when your data is not in a way that can work, a pivot may be an answer to your problem.
I want to show an example of how the pivot function works. Let’s say that I have a table that gives me a store number, a rating for that store, and a log of “Advice” administered to the store. I don’t necessarily care about each instance of advice given to the store, but I care more about the number of times advice was given.
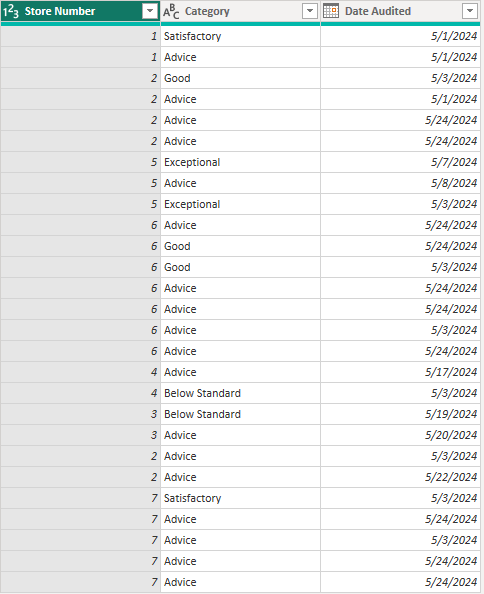
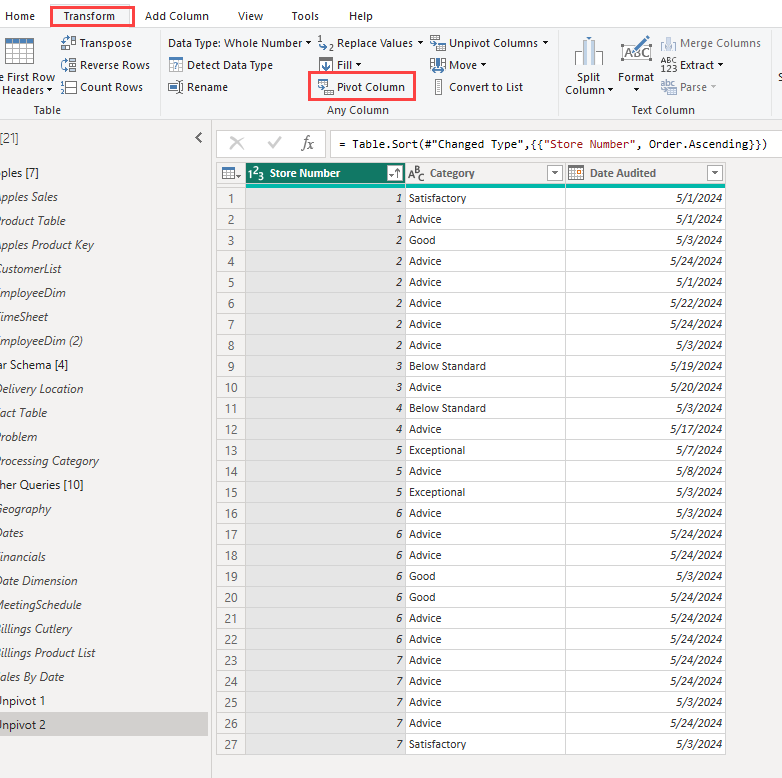
Let’s use a pivot on this table to get a count of each value in our “Category” column.
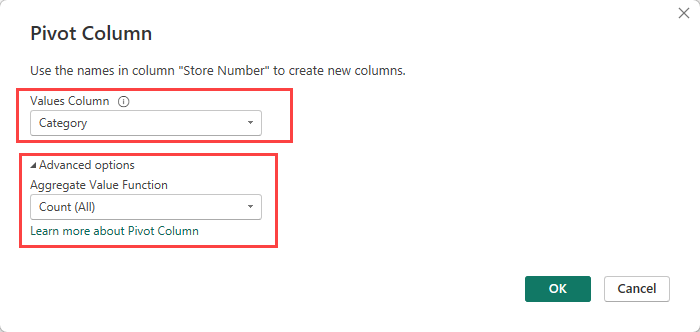
You will get a popout when using the pivot function. Here is what I entered for my query. My goal is to count the number of times each store number gets a value from the category column.
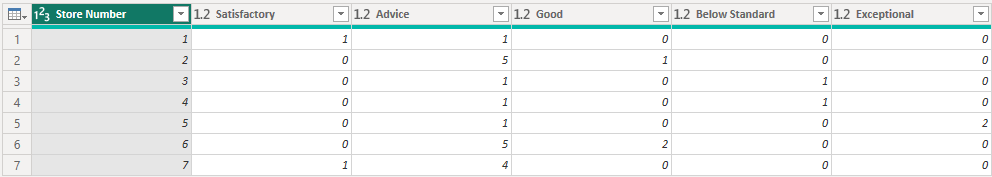
And finally, here is my result.
There is a lot of potential for the pivot function because it can do several different functions besides counting. This is the complete current list of functions that are allowed:
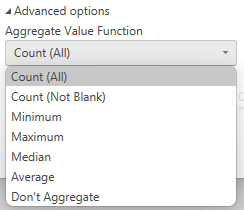
In many cases this is function is going backwards to what you generally want with a Power Query table. Most of the time the goal will be to get a vertical table setup, but if this is not what you need the pivot function can solve your problem.
Conclusion
Over the past couple of years, I haven’t found many use cases for the Pivot function in Power Query, but when you need it, you need it. There are several other methods that you can use to get a similar solution to what a pivot function does, but a pivot function can quickly be a strong asset to your Power Query transformations. If you enjoyed this blog, I recommend reading through some similar blogs linked below.
Links Related to This Blog:
Comments
Leave a Reply
You must be logged in to post a comment.