Power BI – Dynamic Date Selection
By: David Rohlfs
Introduction
For the past year of working on Microsoft Power BI I have had a dream of a slicer where I get to choose what columns are inside of my table. I still haven’t been able to figure out a way that I can do this, but I did think of a way to do something similar.
Let me set up the situation I was in. I had to come up with a way to be able to display multiple date selections, like YTD, PYTD, Previous Year, etc., on a page without using the normal date hierarchal slicers. Normally what you would do in this situation is just create a bunch of columns on a table or matrix and call it good, but again, that was not an option. So, what if there was a way to use a slicer to change two or three columns that were displayed on the table? This blog is about my solution to this problem.
This blog will be using some advanced concepts in DAX, M Code, and Power BI in general. I will link all related blogs that have the basics concepts at the end of this blog in case you get lost or want to see why I am using the method I am using.
The method that I will describe is specifically tied to dates. You can do a much simpler set of DAX equations if you are not using dates, but I see most cases for this method containing dates.
In this blog we will go over how to create a dynamic set of columns based on a slicer, when you should use this method, some problems you may encounter, and a walkthrough describing how to implement this method.
When to use it
Let’s start by talking about what the method is that I am even writing about.
My goal was to create a slicer that could dynamically change two columns inside of a table. The slicer contains values that are based on sales amounts from different time periods. The time periods could be:
- Previous YTD
- Previous Year
- Previous Calendar Year
- Previous QTD
- Previous Year QTD
- Previous Quarter
- Previous Year Quarter
- Previous MTD
- Previous Year MTD
- Previous Month
- Previous Year Month
- And any other Time periods that you may be interested in.
You may have noticed that I never specify the current time period. This is because we are going to build that into the DAX to reflect the option chosen. For example, you are in Q2 of 2024 and you select Previous Quarter. There will be a column inside the table that reflects the current Q2 sales amounts and a column that shows then entire Q1 amounts. Column 1 will always reflect the current time period of column 2.
I know that all of this seems confusing, but once you start seeing how it works, everything will make much more sense.
Now that we know what this method is, let’s talk about why you would want to use it.
I used this method in a situation where the report end users did not like to choose dates based on a normal hierarchal data slicer or a between slicer. They also did not want to have more than just a few columns inside of the main table on the page. So, my goal was to find a way to minimize used space while maximizing useability.
While it was important to minimize the time spent doing this it was not a priority goal. This is important to note because the advanced set of DAX that I will give you is prone to being broken by people who do not understand how to use it. This is part of the reason why this blog is so wordy and long. In order to effectively use, implement, and fix this set of DAX, you must understand what is happening.
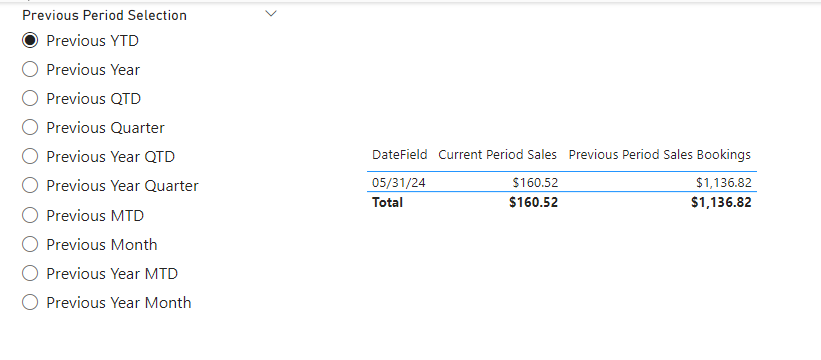
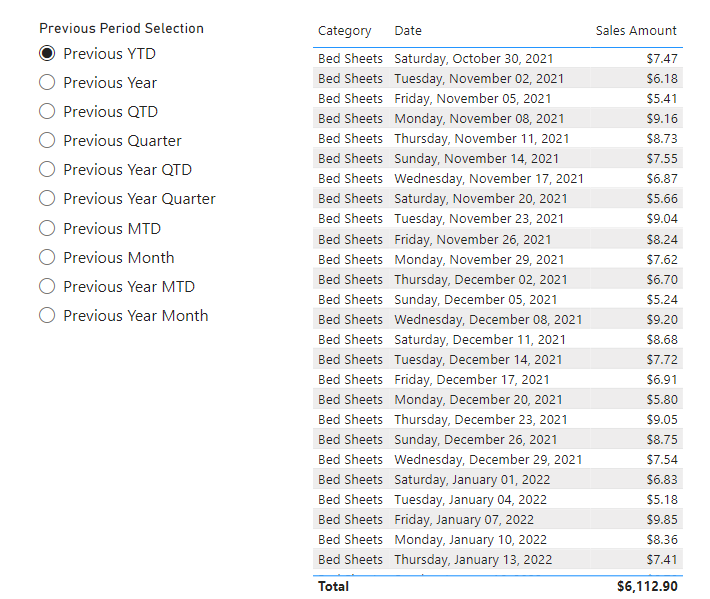
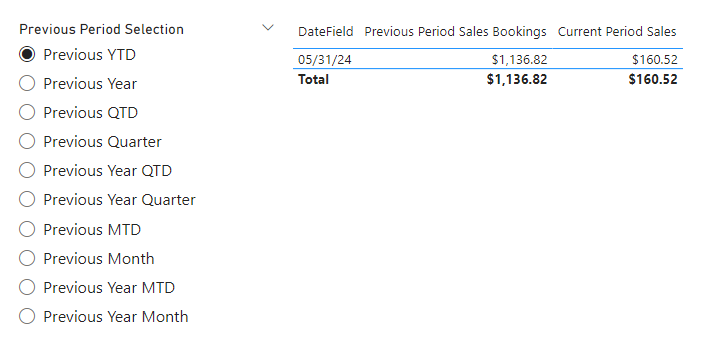
Now that we have gone through all the background, let me show you what I mean. In the top left of this report page, I have my Period Filter slicer. This is where the end user gets to change what period they are viewing. Then our main visual is the table. In this table we have todays date, the Current Period Sales, and the Pervious Period Sales You can build many more columns based on the current and previous period, but we will not over that in this blog.
It is good to note that in most cases with this you would not be categorizing your data by date, but by category.
In this method you will need to have at least three different tables inside of your model. And, if you want to avoid using M Code, you will need to have four. The first is the Period Filter table.
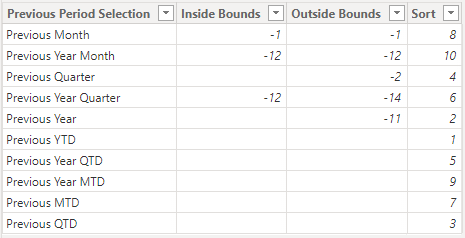
This table has three columns inside of it.
- Period Selection
- This is going to contain all of our period selection values. This is where you will initially add more options to your period selection in the future.
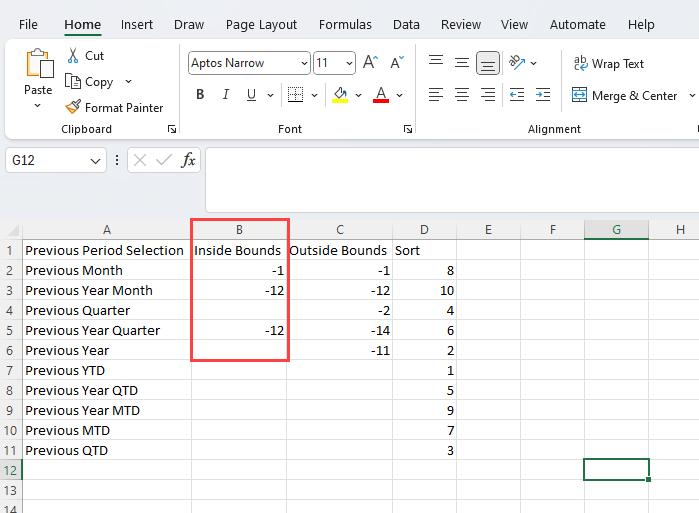
- Inside Bounds
- Once we get to the DAX, you will see that our inside bound is the higher of the bound’s numbers. This is due to the fact that we are always going back in time with these calculations.
- What this column is here for is to be a calculation help for our bounds inside of DAX. For example, when you need to get the previous month, you are going back in time one month. This is why you have -1.
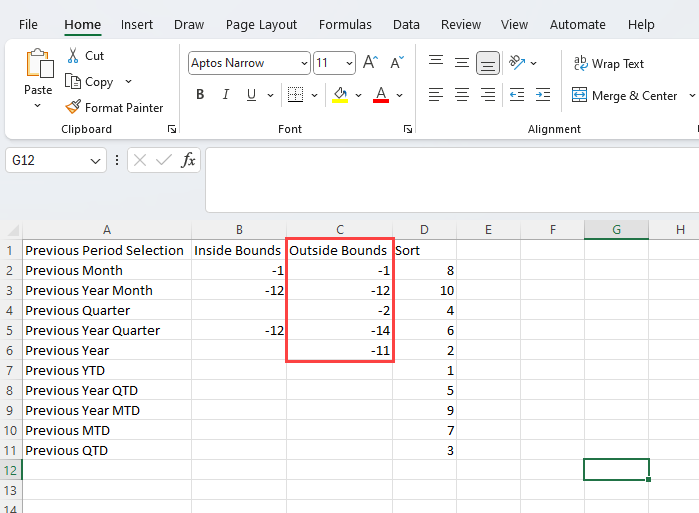
- Outside Bounds
- Similar to the Inside Bounds, our outside bound is the index number that will be our lower amount.
- Notice that in our previous month’s row, our inside and outside bounds are the same. This is because we only want the previous month, and when we set up our calculations, we only want to encapsulate the previous month with our bounds. If we were doing our calculations on a finer scale, like days, you would get more values in each of these fields. This will make more sense in the future once we build out our DAX.
- Sort Column (Optional)
- I created a sort column that uses the Sort by Column feature in Power BI.
The next table that we need is our fact table. I will be using a sample file that I created to be a Sales Fact Table.
- This table will probably contain the category for the visual table in your report. You can get around this with model relationships.
- It will also contain the main amount we will calculate on. I am just going to use the Sales column for this.
Our last table will need to be the Date Dimension. I highly suggest copying the M code from the Date Dimension below as your date dimension. This will eliminate the need for the use of the fourth table.
Note: This date dimension does NOT contain any fiscal year columns. I have not built out anything for fiscal year data in this blog and do not plan to. This method will work with a fiscal year, but the DAX and the tables become more complicated and very specific to the fiscal year that will be used.
If you are not using the date dimension from below and do not want to try and create the extra columns needed on your own, you will need this fourth table.
This table is very important in getting the sales values that are not “to-date” values. Notice that I did not include the days of each month on this table. This is because I am not worried about going to the day level for this blog. The DAX that I have written uses “to-date” functions and equations, so we do not need to get that granular. If you wanted something like the previous 30, 60, or 90 days, then you may need to have a table that represents days as well. But, if you need days, I suggest just using the date dimension because it is already built to work.
Let’s take a minute and talk about one important aspect of this method that will be very easy to overlook. The slicer needs to be single select! You can change this inside the format pane while the slicer is selected. If the slicer is not single select, you will get an error if you try and do more than one time period at a time. While this is easy for developers to understand, it can be much more aggravating for an end user when they do not see the data appear.
I know that this method is going to be too complicated for most because of how in-depth it is. So, I am including a list of alternative methods that I suggest in its place.
Alternative Methods:
- Creating selection columns inside of your Date Query.
- You could go in and create a column for each of the options in your slicer that represents a true or false value while inside of the Power Query. This would simplify the DAX code on the front end but would increase the M Code complexity on the back end.
- Using a Date Hierarchy slicer.
- One of the stipulations for creating this method was that I could not use a date hierarchy slicer. If you can, I highly recommend going this route because any future changes to what dates need to be selected can create problems depending on how you set up your Date dimension or Table 4.
- Using more columns inside of your table.
- This will allow you to write many more measures in DAX and avoid using the supplementary tables to help select your values. What I mean is that you would have a column for each of the options inside of the slicer, instead of having only two columns and the slicer.
- Using Calculation Groups
- This is brand new as of writing this blog, so I haven’t spent much time learning what they are, but it looks like they don’t do exactly what this method is doing. The difference in this method is that we are using two different types of calculations. One for the current period and one for the previous period.
Common Problems
No Fiscal Year
With the DAX and M Code written below, there are no calculations to account for a fiscal year. While writing this blog, I have been working on implementing this process and I will tell you that it removes the use of the YTD, QTD, and MTD functions inside of the DAX equations. This is much more complex and requires more understanding, but it is very doable.
Random Breaks
There have been a lot of times where I get to do a new calculation, and everything breaks. Then I fix the bug, and it all breaks again. Because we are using a method that has two different styles (“to-date” DAX and index based DAX), when you fix a problem for one set of calculations the other breaks. This can be avoided by using entirely index based DAX, but that brings in more complexities with how you get your active periods.
Calculated Column vs. Measure
There are some things that this method cannot do, and one of the biggest of these is that creating a calculated column displaying the values doesn’t work. Because we are jumping through many hoops (multiple supplementary measures) to get to our final values, there is not an option to go back to creating a calculated column with the final values. You might be able to use all calculated columns, and everything will work, but I am not at all sure of this. And it would take a hit on your performance and refresh times.
Walkthrough
There isn’t a great way to describe every little nuance behind this method while in the blog and this can create some difficulties while going through the walkthrough. So, if you have not read through the When to Use It portion of the blog, you should go back and do that now.
Also, the walkthrough and DAX that I will be using is only going to go to the month level and will use the fourth table method described above. This is just so that we keep everything at the month level and don’t bring in the complexities of the day level to this blog.
Let’s start by creating our Filter Table.
We can do this by entering our data into an excel sheet, or just clicking the enter data option in the Home Ribbon on the Report Page.
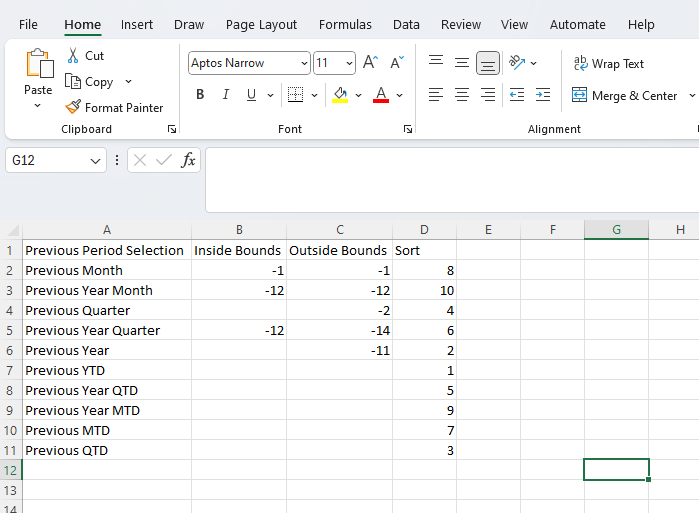
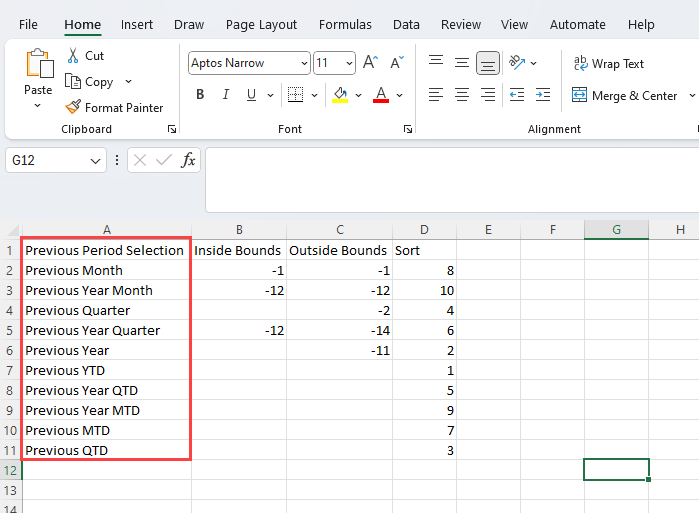
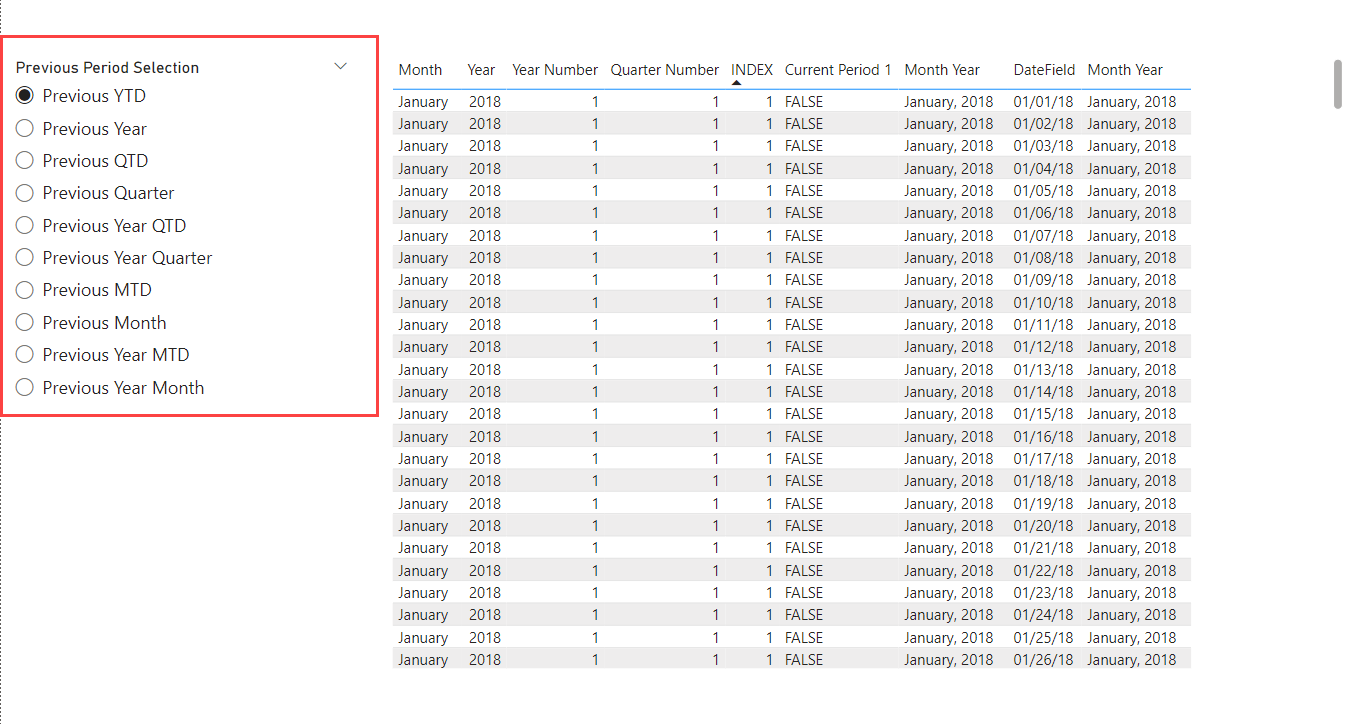
Our first column is going to be our Previous Period Selection. This is the column that will become our final slicer, so make it readable and easy to understand.
Now let’s create our Inside Bounds. If you are confused on why these amounts are how they are, go reread the section where I describe this in the When to Use It.
Next is our Outside Bounds.
Finally on our table is our Sort Column. We will be using this column to sort out the Previous Period Selection options once in our slicer to be more readable and navigable for our end users. This method is described in the Sort by Column blog linked below.
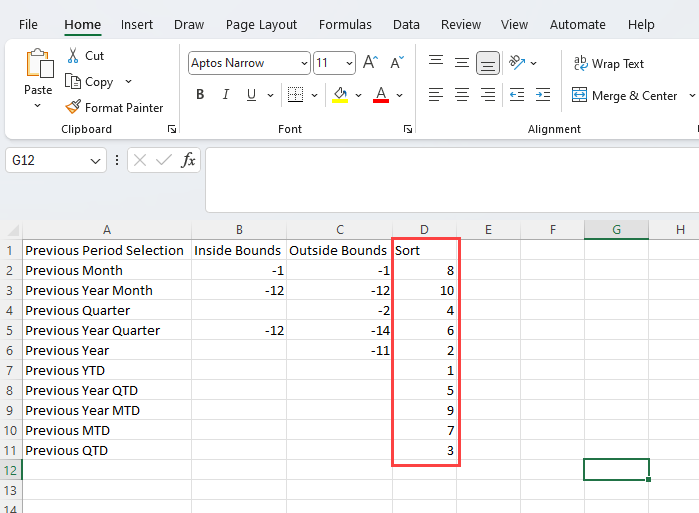
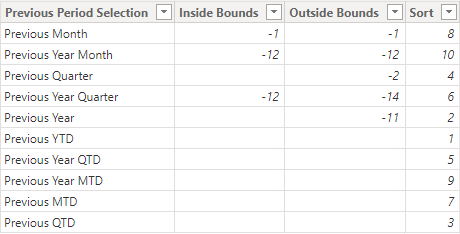
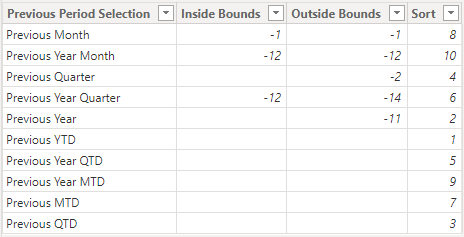
Here is the final table that we have created.
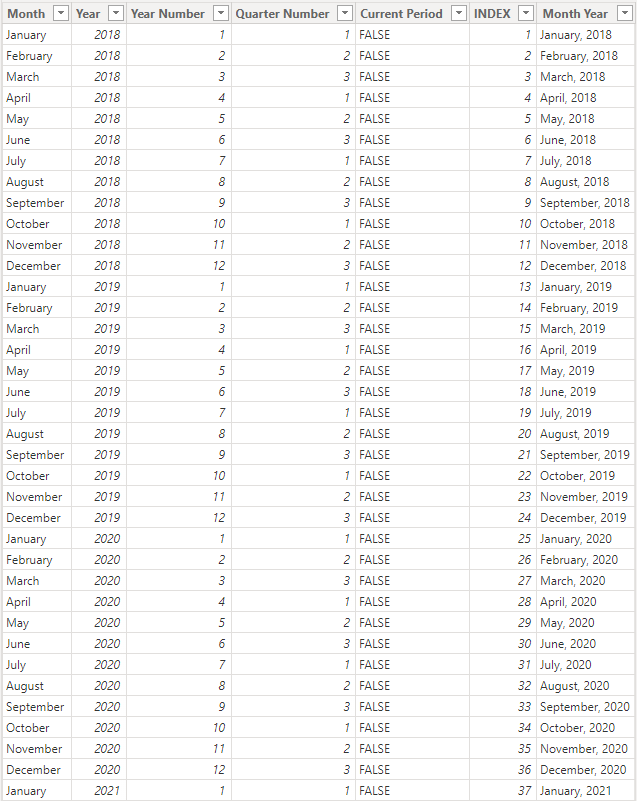
Now, let’s talk about our second table that we will be using. This is the fourth table that is optional and is not needed if you have a good enough Date Dimension, but for simplicity, we will use this table.
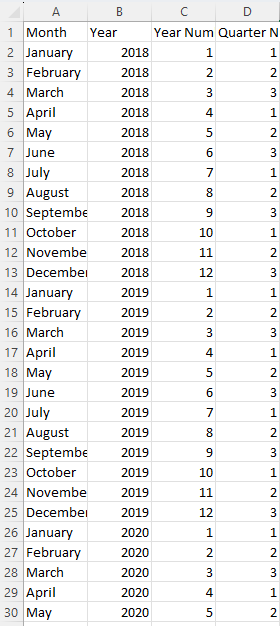
We are going to start by creating the first four columns in Microsoft Excel. We need our Month Name, Year, Year Number (month of the year), and our Quarter Number (month of the quarter). Our Year Number and Quarter Number are counting the months because that is the level of detail that we are wanting in our end result. Remember, we are only concerned with getting to the month because we can use other DAX calculations to grab our “to-date” values.
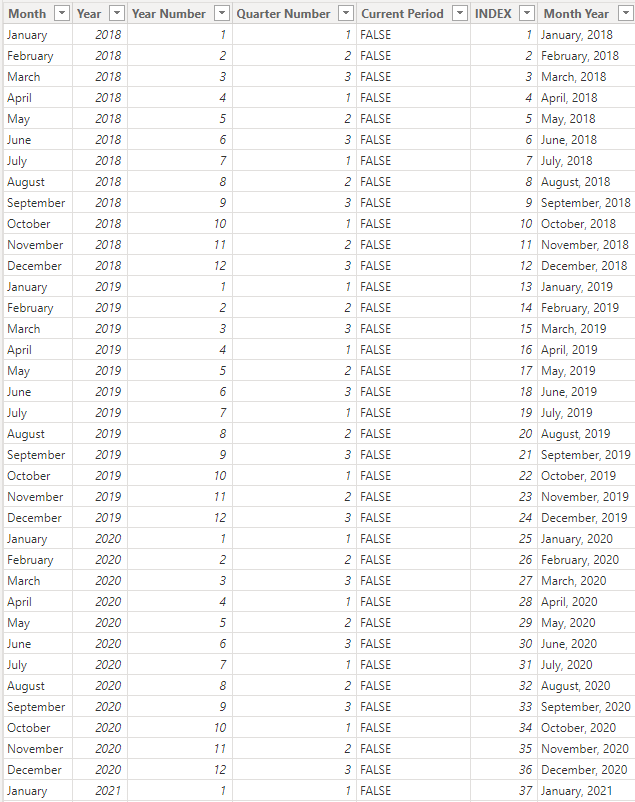
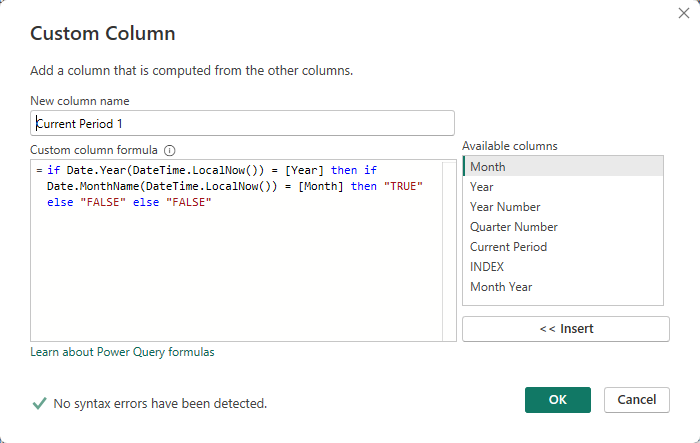
Now we can upload this to Power BI and go into our Power Query. This is where we will create our other three columns. Let’s start by creating a custom column that will be our Current Period column. The goal for this column is to have an indicator of what month and year we are in. To see how to do this in detail, read through the Adding A Custom Column blog. Here is what my final Column pop-out looks like.
Once I have created my column, make sure that it is a text column. If it is not, this will create problems later on.
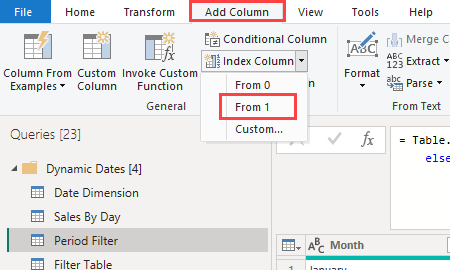
Now we are going to create our index column. We want to make sure that we have not sorted our table, and if we have, that our table is sorted in a way that goes from earliest date to latest date. We are going to do our index from 1 just to help the math later on. See how to do this in the Index Function in Power Query blog.
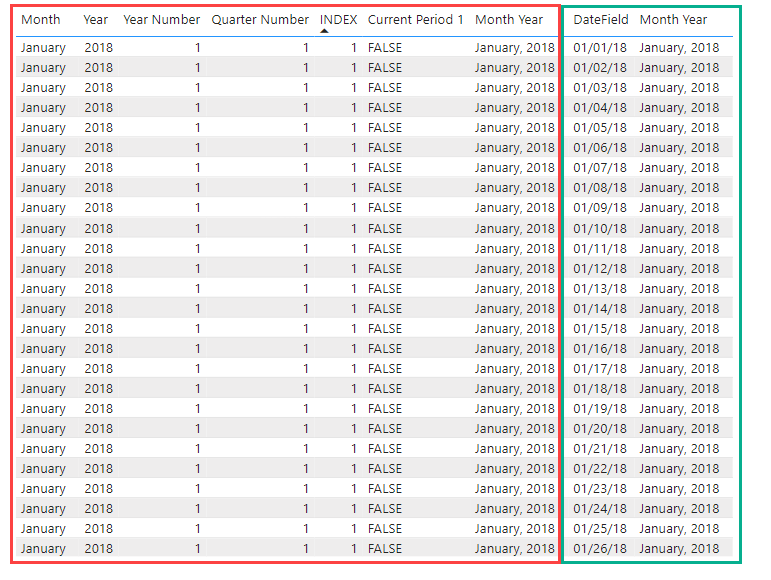
Finally, we are going to create a merged column between our month and our year. We will do this inside of this table and inside our Date Dimension so that we can make a relationship later on. To do this we are going to use a Column from Examples because it is simpler than writing out the code. See related Column from Examples blog below.
![]()
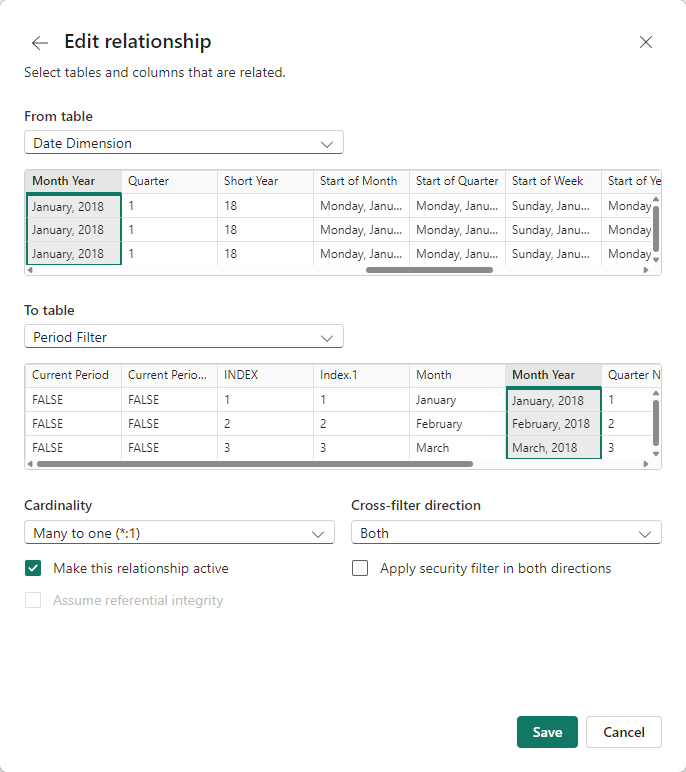
Remember to create the Month Year column inside of your Date Dimension, this will be important to create a relationship.
Once we have finished creating these tables, we can get out of Power Query and focus on creating our DAX equations. Lets start by building out our first test page. I am going to create a table that has our second table values inside of it along with our date dimension date field.
We still need to connect our second table to the date dimension using a relationship. I will do this using the Month Year columns that we created as our Key Columns.
Next let’s put our period selection slicer into our page and make sure that it is a single select slicer.
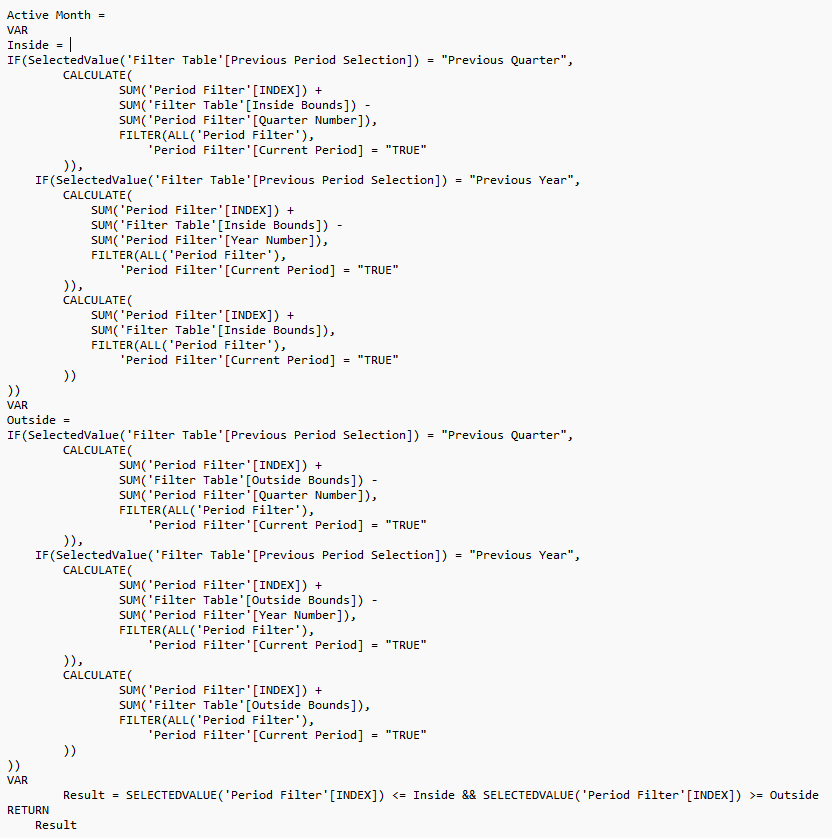
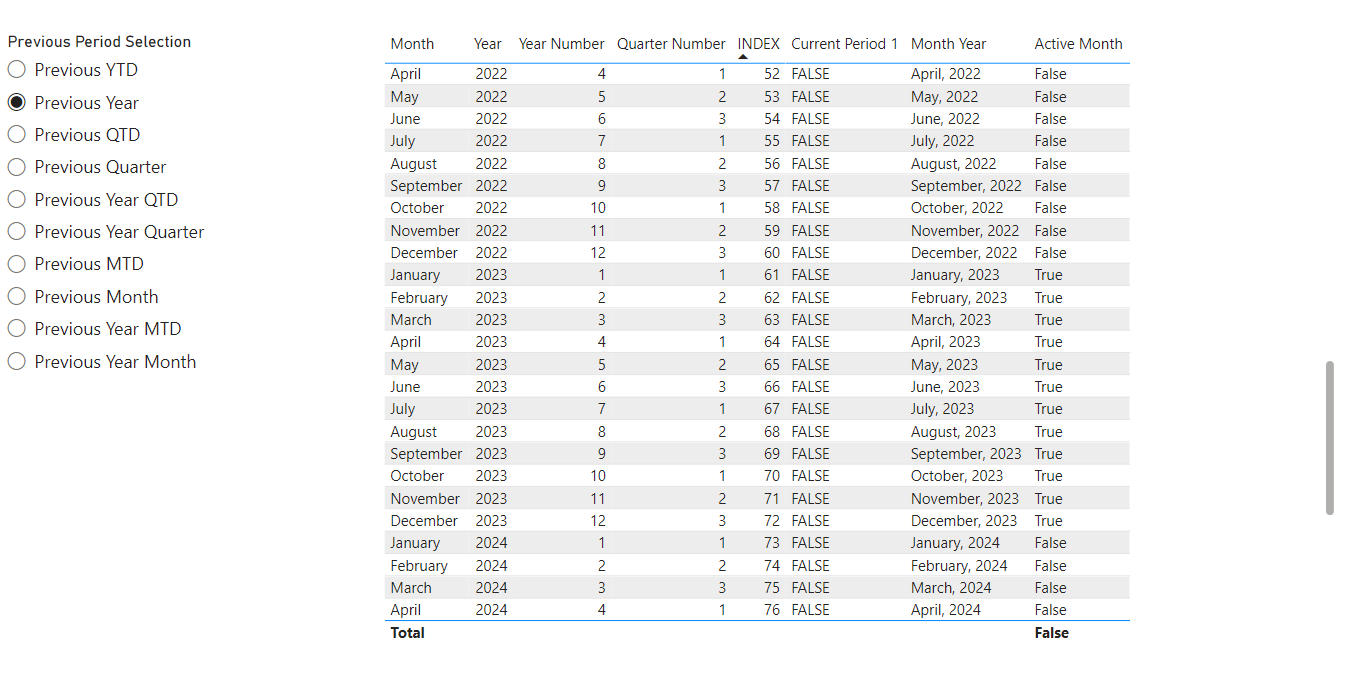
Now we are going to start by creating an “Active Month” measure that will be used later as a filter to find our amounts on. This is the final DAX equation that I have used:
This is where you will need to test that each of your periods in your period selection slicer works properly. If they do not, you may need to adjust your inside and outside bounds from your first table. Note: The To Date measures work differently. Only the measures that are at the month level work for this testing if you are using the fourth table method (as shown in this walkthrough).
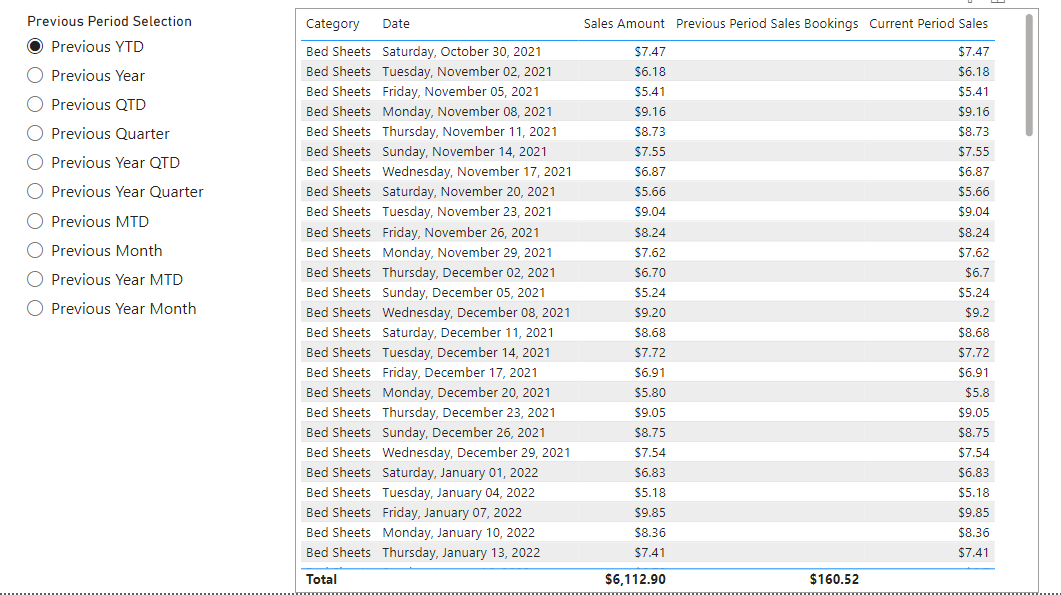
Once you get your active month measure working, we can go to a new page that will contain our fact table data. Here is my example page. I have created a table that contains data from the fact table about the different product names.
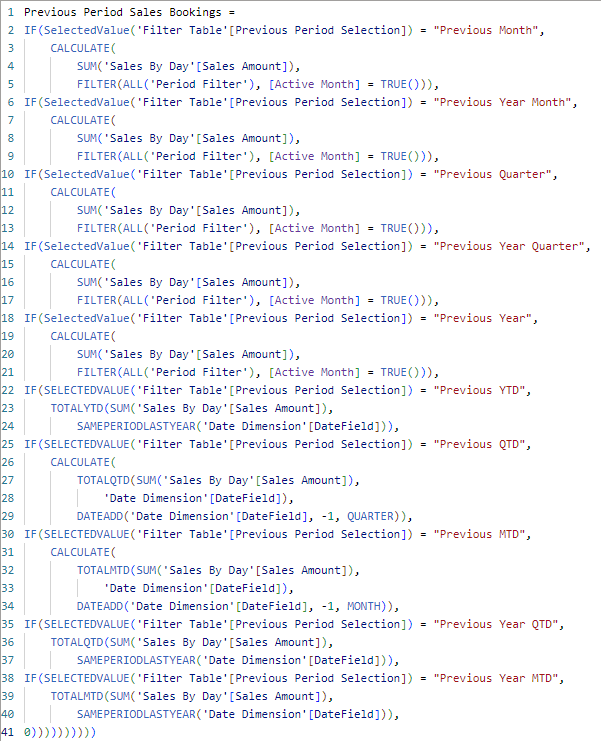
Now we can create our measures that will calculate the sales for each period. Here is my Previous Period Sales Amounts equation:
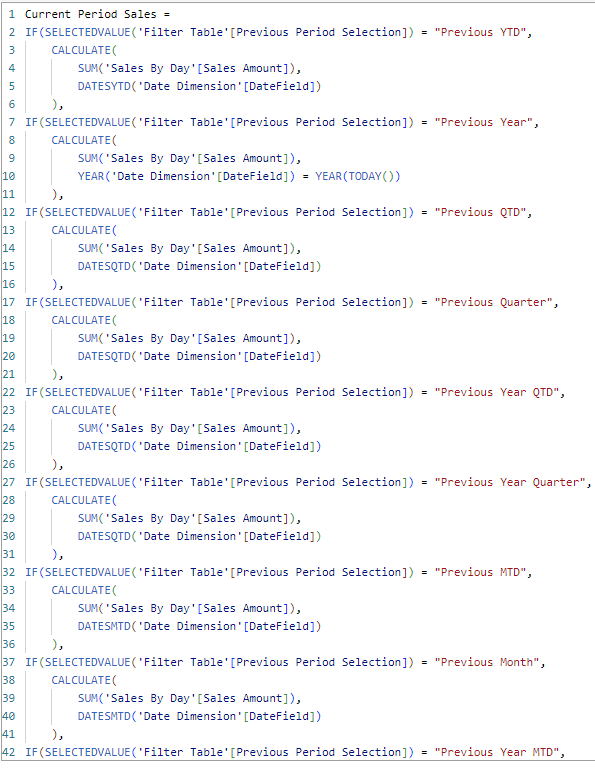
This is my Current Period Sales Amount equation:
With both of these in my table, I can select the previous period that I want to follow, and the measures will automatically adjust to filter for the periods that are required.
Now let’s look back at my current period measure. When I select previous year in my period selection, my current period is considered all YTD sales. This equation assumes that you cannot have a sale after today. If this is not the case, you may need to alter the Current Period Sales Amount equation.
If you are using a date dimension for your calculations, then you need to filter the Date Dim date field by today, or if you are using the fourth table option, then you need to filter the Current Period column by True. This is because of the All functions in our equations that allow us to get this year and last year’s data in the same line. I know this might be a little confusing, but it has to do with having both last year and this year’s dates and how the YTD calculations work.
With all of this in place we can now test out our slicer and measures. I would suggest spending a good amount of time verifying your data. Because of the nature of dynamic measures and the addition of having dates with these, there is a lot of room for error when setting up all the steps for this to work.
Conclusion
This entire method is very complex and tends to break during the development phase. If you want to ask questions or need help, please feel free to contact us at Training@EPMStrategy.com.
I hope that you enjoyed this blog. I know that it was much longer and much more intense than many others. If you want to read more about the specific DAX functions some of them will be linked below. I am also linking some other advanced blogs below in case those interest you.
DAX and M Code Formulas
Active Month =
VAR
Inside =
IF(SelectedValue(‘Filter Table'[Previous Period Selection]) = “Previous Quarter”,
CALCULATE(
SUM(‘Period Filter'[INDEX]) +
SUM(‘Filter Table'[Inside Bounds]) –
SUM(‘Period Filter'[Quarter Number]),
FILTER(ALL(‘Period Filter’),
‘Period Filter'[Current Period] = “TRUE”
)),
IF(SelectedValue(‘Filter Table'[Previous Period Selection]) = “Previous Year”,
CALCULATE(
SUM(‘Period Filter'[INDEX]) +
SUM(‘Filter Table'[Inside Bounds]) –
SUM(‘Period Filter'[Year Number]),
FILTER(ALL(‘Period Filter’),
‘Period Filter'[Current Period] = “TRUE”
)),
CALCULATE(
SUM(‘Period Filter'[INDEX]) +
SUM(‘Filter Table'[Inside Bounds]),
FILTER(ALL(‘Period Filter’),
‘Period Filter'[Current Period] = “TRUE”
))
))
VAR
Outside =
IF(SelectedValue(‘Filter Table'[Previous Period Selection]) = “Previous Quarter”,
CALCULATE(
SUM(‘Period Filter'[INDEX]) +
SUM(‘Filter Table'[Outside Bounds]) –
SUM(‘Period Filter'[Quarter Number]),
FILTER(ALL(‘Period Filter’),
‘Period Filter'[Current Period] = “TRUE”
)),
IF(SelectedValue(‘Filter Table'[Previous Period Selection]) = “Previous Year”,
CALCULATE(
SUM(‘Period Filter'[INDEX]) +
SUM(‘Filter Table'[Outside Bounds]) –
SUM(‘Period Filter'[Year Number]),
FILTER(ALL(‘Period Filter’),
‘Period Filter'[Current Period] = “TRUE”
)),
CALCULATE(
SUM(‘Period Filter'[INDEX]) +
SUM(‘Filter Table'[Outside Bounds]),
FILTER(ALL(‘Period Filter’),
‘Period Filter'[Current Period] = “TRUE”
))
))
VAR
Result = SELECTEDVALUE(‘Period Filter'[INDEX]) <= Inside && SELECTEDVALUE(‘Period Filter'[INDEX]) >= Outside
RETURN
Result
Previous Period Sales Bookings =
IF(SelectedValue(‘Filter Table'[Previous Period Selection]) = “Previous Month”,
CALCULATE(
SUM(‘Sales By Day'[Sales Amount]),
FILTER(ALL(‘Period Filter’), [Active Month] = TRUE())),
IF(SelectedValue(‘Filter Table'[Previous Period Selection]) = “Previous Year Month”,
CALCULATE(
SUM(‘Sales By Day'[Sales Amount]),
FILTER(ALL(‘Period Filter’), [Active Month] = TRUE())),
IF(SelectedValue(‘Filter Table'[Previous Period Selection]) = “Previous Quarter”,
CALCULATE(
SUM(‘Sales By Day'[Sales Amount]),
FILTER(ALL(‘Period Filter’), [Active Month] = TRUE())),
IF(SelectedValue(‘Filter Table'[Previous Period Selection]) = “Previous Year Quarter”,
CALCULATE(
SUM(‘Sales By Day'[Sales Amount]),
FILTER(ALL(‘Period Filter’), [Active Month] = TRUE())),
IF(SelectedValue(‘Filter Table'[Previous Period Selection]) = “Previous Year”,
CALCULATE(
SUM(‘Sales By Day'[Sales Amount]),
FILTER(ALL(‘Period Filter’), [Active Month] = TRUE())),
IF(SELECTEDVALUE(‘Filter Table'[Previous Period Selection]) = “Previous YTD”,
TOTALYTD(SUM(‘Sales By Day'[Sales Amount]),
SAMEPERIODLASTYEAR(‘Date Dimension'[DateField])),
IF(SELECTEDVALUE(‘Filter Table'[Previous Period Selection]) = “Previous QTD”,
CALCULATE(
TOTALQTD(SUM(‘Sales By Day'[Sales Amount]),
‘Date Dimension'[DateField]),
DATEADD(‘Date Dimension'[DateField], -1, QUARTER)),
IF(SELECTEDVALUE(‘Filter Table'[Previous Period Selection]) = “Previous MTD”,
CALCULATE(
TOTALMTD(SUM(‘Sales By Day'[Sales Amount]),
‘Date Dimension'[DateField]),
DATEADD(‘Date Dimension'[DateField], -1, MONTH)),
IF(SELECTEDVALUE(‘Filter Table'[Previous Period Selection]) = “Previous Year QTD”,
TOTALQTD(SUM(‘Sales By Day'[Sales Amount]),
SAMEPERIODLASTYEAR(‘Date Dimension'[DateField])),
IF(SELECTEDVALUE(‘Filter Table'[Previous Period Selection]) = “Previous Year MTD”,
TOTALMTD(SUM(‘Sales By Day'[Sales Amount]),
SAMEPERIODLASTYEAR(‘Date Dimension'[DateField])),
0))))))))))
Current Period Sales =
IF(SELECTEDVALUE(‘Filter Table'[Previous Period Selection]) = “Previous YTD”,
CALCULATE(
SUM(‘Sales By Day'[Sales Amount]),
DATESYTD(‘Date Dimension'[DateField])
),
IF(SELECTEDVALUE(‘Filter Table'[Previous Period Selection]) = “Previous Year”,
CALCULATE(
SUM(‘Sales By Day'[Sales Amount]),
YEAR(‘Date Dimension'[DateField]) = YEAR(TODAY())
),
IF(SELECTEDVALUE(‘Filter Table'[Previous Period Selection]) = “Previous QTD”,
CALCULATE(
SUM(‘Sales By Day'[Sales Amount]),
DATESQTD(‘Date Dimension'[DateField])
),
IF(SELECTEDVALUE(‘Filter Table'[Previous Period Selection]) = “Previous Quarter”,
CALCULATE(
SUM(‘Sales By Day'[Sales Amount]),
DATESQTD(‘Date Dimension'[DateField])
),
IF(SELECTEDVALUE(‘Filter Table'[Previous Period Selection]) = “Previous Year QTD”,
CALCULATE(
SUM(‘Sales By Day'[Sales Amount]),
DATESQTD(‘Date Dimension'[DateField])
),
IF(SELECTEDVALUE(‘Filter Table'[Previous Period Selection]) = “Previous Year Quarter”,
CALCULATE(
SUM(‘Sales By Day'[Sales Amount]),
DATESQTD(‘Date Dimension'[DateField])
),
IF(SELECTEDVALUE(‘Filter Table'[Previous Period Selection]) = “Previous MTD”,
CALCULATE(
SUM(‘Sales By Day'[Sales Amount]),
DATESMTD(‘Date Dimension'[DateField])
),
IF(SELECTEDVALUE(‘Filter Table'[Previous Period Selection]) = “Previous Month”,
CALCULATE(
SUM(‘Sales By Day'[Sales Amount]),
DATESMTD(‘Date Dimension'[DateField])
),
IF(SELECTEDVALUE(‘Filter Table'[Previous Period Selection]) = “Previous Year MTD”,
CALCULATE(
SUM(‘Sales By Day'[Sales Amount]),
DATESMTD(‘Date Dimension'[DateField])
),
IF(SELECTEDVALUE(‘Filter Table'[Previous Period Selection]) = “Previous Year Month”,
CALCULATE(
SUM(‘Sales By Day'[Sales Amount]),
DATESMTD(‘Date Dimension'[DateField])
),
0))))))))))
Links to Related to This Blog:
Comments
Leave a Reply
You must be logged in to post a comment.