Power BI Sort by Column
By: David Rohlfs
Introduction
Sort by Column is a very useful function to format your data. It is commonly used when you are creating tables, matrixes, slicers, and some graphs. This function can help to arrange your data in a way that is more specific and ordered in a way that can be helpful to your report.
The ability of the Sort by Column is to sort your data by another column in your data source. You can still sort ascending or descending, but this adds another element of sorting it by a group. For example, if you wanted to sort twenty dates by four products, you can use the sort by column function to put the first products dates together, the second products dates together, and so on.
How it is used
Sort by column is used to format your data by something other than alphabetical or numerical order. Using this function allows you to sort your data by a location, a date, a product, a subproduct, a size, etc. Sort by column can allow the user to group their data so that data can be more specified. This function would be like creating a column that had a prefix that specified an area, with a suffix that showed the date.
There are some downsides to using this function. A few of the common ones are:
- A common error code (look at Common Problems below).
- Data looking confusing – the data may look out-of-order if your end user is not proficient in the report view.
- You might not have a strong reason to use this function. There are a lot of times when formatting your data and making it look a certain way that makes sense to you as a report writer can become more confusing than helpful to the end user.
In many ways this function can look confusing for an end user. If you do want to use it, remember to think about what your end user will see when they look at it; will it look clean and professional, or will it look unorganized and jumbled?
I would recommend using this function for these reasons:
- To group your data together by another field (Column) so that it represents your data better than the default setting.
- When working with a large set of data that is out of order.
- When you want to be more specific than sorting by ascending or descending order.
Common Problems (Common Error Codes)
A common error when using Sort by Column is repeating Data. If this happens you should get an error code that looks like this:
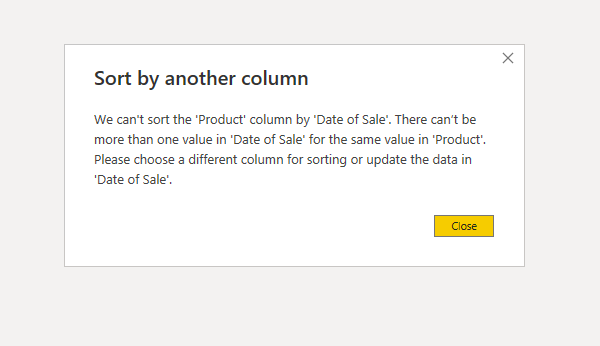
What is happening is that Power BI doesn’t know how to put the data in order because of duplicates. You can avoid this by checking beforehand whether your data has duplicates in the column you are trying to sort. If it helps, you can think of this error code saying you have a “many-to-many” relationship.
If this problem does occur there are a couple of solutions that might work. You can enter DAX or M query expressions that alter your data to be more specific, you can check which rows are duplicated, you can use a custom table that doesn’t have any duplicated cells. There are some other solutions floating around on the Power BI community forums, but most of them just restate the use for a column with no duplicated cells.
Walkthrough
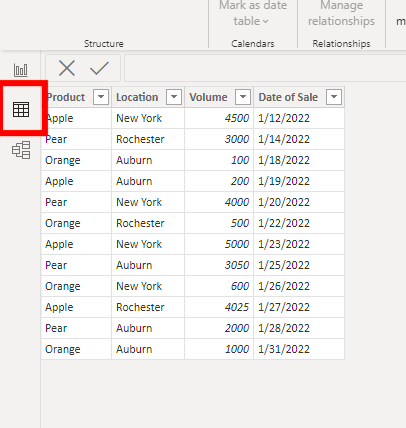
This walkthrough shows a simple example of how to use the Sort by Column function. We will be sorting a date column by a Product column.
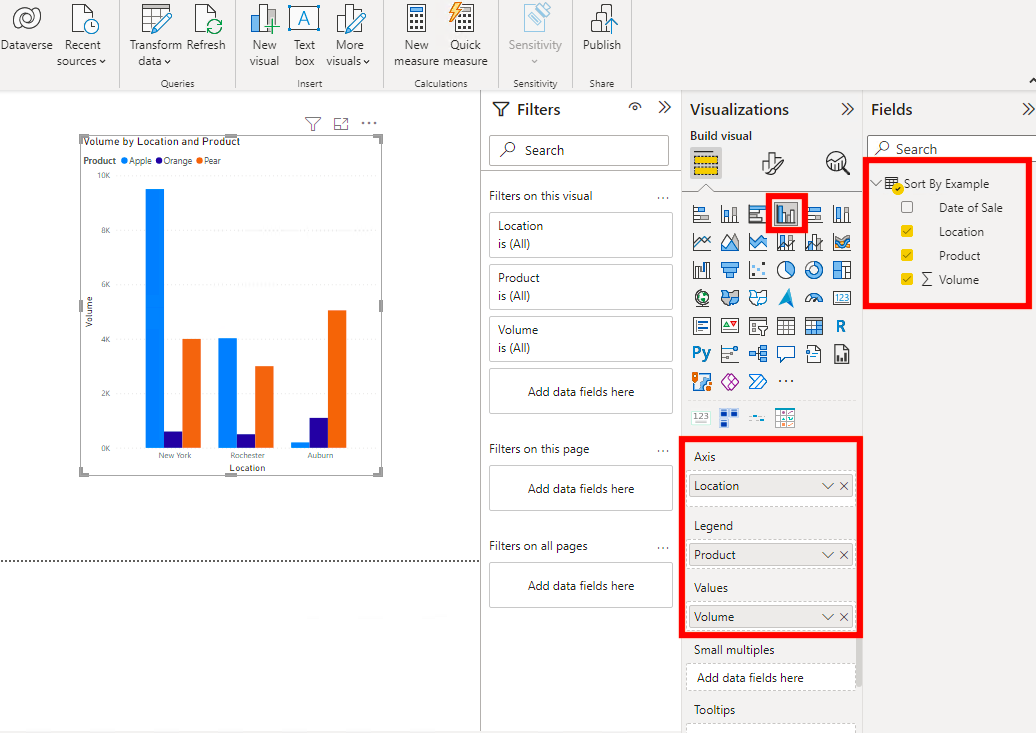
I like to make a matrix or graph that illustrates what data I am working with. Using a clustered column graph, I am going to put the “Location” on the Axis, “Product” in the Legend, and “Volume” in the values.
You can also grab a slicer and put the field you will be changing in it. I used a date field.
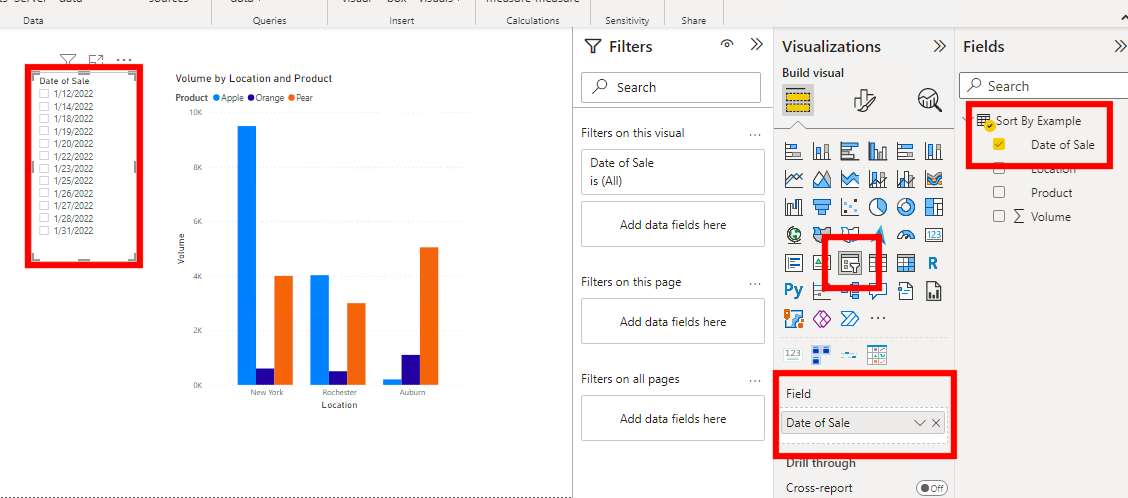
You can see how in this slicer the dates are shown in ascending order. What we want to do is to view them by the product then the date.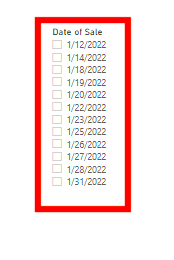
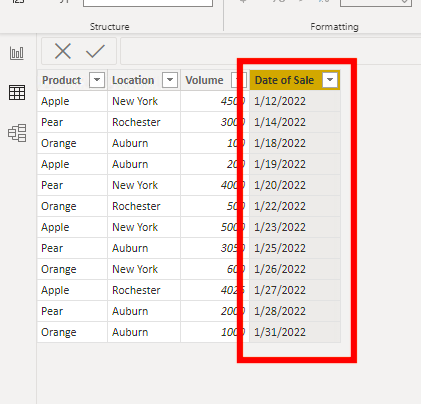
To do this we will go to the Data Table View.
Next, select the column you would like to sort.
Click on “Sort by Column” and choose which column you want to sort by. I chose to sort by the Product Column.
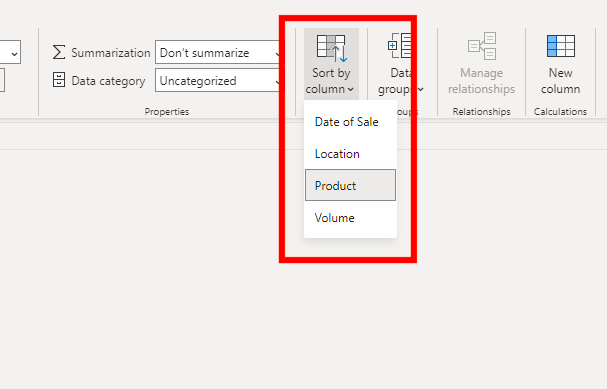
This is a common spot to get an error. If you do get an error, you can look at the Common Problems section above.
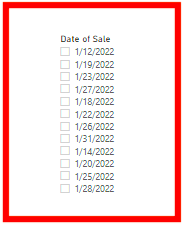
You Probably won’t see anything change on the data table view, but once you go back to the report view, you can check on your slicer.
In the slicer it has ordered the dates by the Product (Column we selected to filter by) then by the ascending order (Because I selected Ascending order in the Sort By tab).
This is just one example of how to use this potentially powerful function.
Comments
One Response to “ Power BI Sort by Column ”
[…] Sort by Column […]
Leave a Reply
You must be logged in to post a comment.