Power BI Row Specific Columns
BY: David Rohlfs
Introduction
One of the most important aspects of Power BI Desktop is the ability to relate tables together so that you can build complex slicers, graphs, and data. To do this there needs to be a column dedicated to each row so that you can find row information that relates to each other from different tables. This has been mentioned in past blogs and is important to developing any report that has more than one set of data.
I have mentioned using row specific columns in the past and want this blog to help explain what they are and why you need them to create a report in Power BI Desktop.
In this blog, we will go through when to use a specific column, a common problem that occurs with these columns, and a walkthrough on building these columns.
When to use it
There are several ways to have a specific column in your data, and many semantic models come with a table that does this for you. These tables could be:
- Product list
- Customer list
- Sales Order table
- Employee list
- Date Dimensions
All the tables have in common that they list each of the subjects they mention, and only list them once. For instance, a product list will show every product that a company has, the product number associated with it, and a description of the product. This same process is true for all the other tables listed; showing the subject, identification number (ID), and description.
A lot of the time, these lists will be embedded in other tables and not have a key pre-made. A sales order table can be built from a sales table, because each sale is usually associated with a specific number to identify that sale. Customers commonly have an identification number so that a sales table shows a customer without the name, and the customer table shows all the information on the customer. To build a new key table from an existing table, see the walkthrough section with example two.
We want to have these specific columns because they allow for the information to have relationships easily. One of the key traits of Power BI Desktop is the ability to relate two different fields (Tables) and display the information in ways that the original table couldn’t do. If you want to learn more about relationships, you can read this EPM Blog on Power BI Basic Relationship Building.
The Date Dimension is different than the other tables listed above but acts in the same way that the others do. This table differs because dates are usually not specific to a person, order, or sale. Why we use dates are to show how that information relates to time and often relative time. To learn more about Date Dimensions, you can read this EPM Blog Why Create A Date Table In Power BI?
Most data sets already have row specific columns present. Usually, they are used to do the same aggregations for non-power BI users, because customers still need to be recognized, and products need to be identifiable by something other than a name.
We develop key’s because people’s names and product names can be the same between different entities. You can have two different John Smith’s that buy your product, but you really don’t want to mess up which John Smith is which. Using an ID for each John Smith lets you relate all their information to something that you built and know will be specific to them.
When you build a relationship between tables that mention the same products or sales, this creates an expanse of uses for Power BI towards your end-user. Because a product number should be listed in your sales table and product list, if you relate the two you can create visuals that display:
- How often a product is bought
- Sales margins on a product
- Discounts that are common to that product
- The number of times that a customer re-purchases the same product
- The average number of units needed and sold per month, quarter, or year
- How product sales relate to one-another
When you start relating these same product numbers and sales numbers to customers, you see relationships in geography, demographics, marketing abilities, and so much more.
Just because you have all the information you need represented in a single table, you should still try to create these columns and lists so that you can allow simple data to make complex and advanced reports.
Common Problems
The most common error when creating these columns is getting many-to-many relationships. If you get this error with these specific columns, you need to figure out why you are getting it. If you have a product list, and the same product is listed twice (By accident), then you can get this error. If you have a sales list and the same sales order number is listed twice, your accounting data will be off. If you have a customer list and the same customer ID is listed with different information, you could be billing someone who didn’t buy the product or send a product to the wrong person.
The best way to deal with these many-to-many relationships is by creating a Key for that information. To learn how to do this, look at the walkthrough example 2.
Walkthrough
You will usually get data with some sort of specifier in each of the rows, but we are going to talk through to methods to create row specific columns. The first one will be using the index column function, and the second will be altering an existing table to create a key table that has specific columns.
Example 1
For this example, we will be using the index function to create an ID number for each row. I don’t suggest this method unless you know your data very well. If you do this, you should know for a fact that there are no repeated data rows, and each row is individual to itself. This method also doesn’t solve many of the needs for a key, so, if possible, I suggest using example 2.
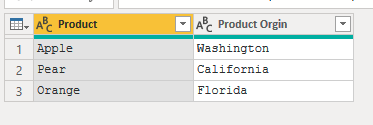
In this screenshot, I see that each of these products are separate to themselves, and each row is individual to itself.
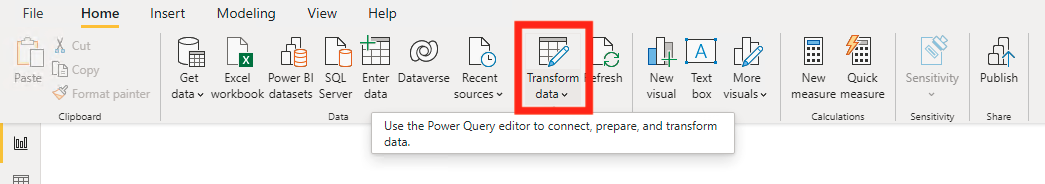
First you will need to go into the Power Query by clicking on Transform Data.
Now click on Add Column, then Index Column.
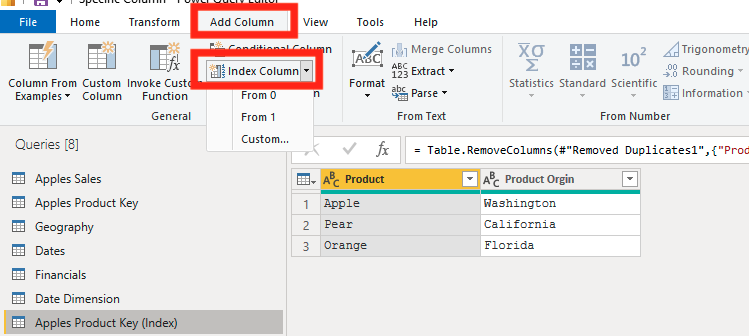
You will see three options come up from the index column button. From 0, From 1, and Custom. These are the starting points from your column. Most of the time you should be using the From 1 selection, but the other two are options if your data is messy. I am going to click on the From 1.
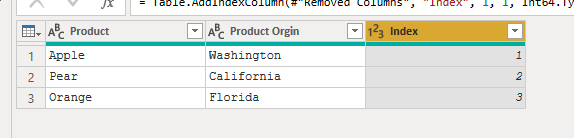
This will create a new column, and make sure that the type is Text, and you rename your column. We want this column to be a text column because we are not going to do an aggregation on this column. This just creates another assurance that someone will understand this if the report is passed onto another report builder.
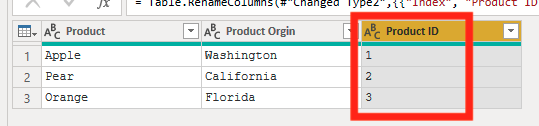
Now you have an ID column that you can use to help create relationships in your data. To use this, you can create a relationship that connects the product names so that you can use your Product ID.
The main reason I don’t like to use this method is because you are still needing to create relationships with the product name. You can avoid this by instead using conditional columns, but that can be tedious.
Example 2
This example will be using existing data to create a key for your tables and fields. To do this, you will need a specific column already present. This can be an ID for a sale, product, customer, etc.
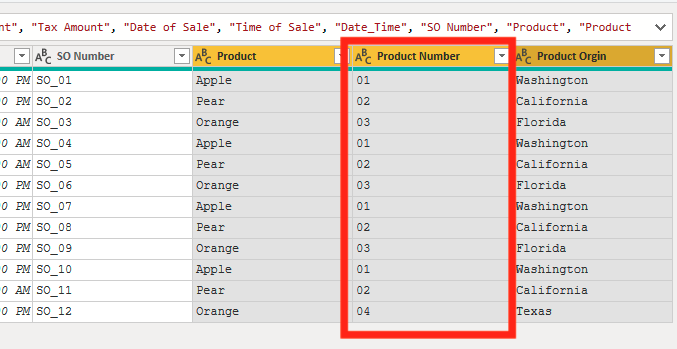
In our starting data, we have a sales table that we want to create a product table from. In this situation, I know that all my products have been sold in this list, so I know that all my Product IDs are in this sales table. This is important because if I hadn’t sold one of my products, then my key won’t have that product ID in it.
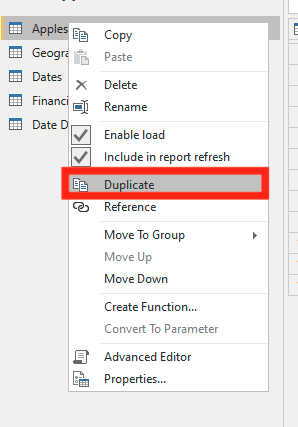
First, we are going to duplicate our query. To do that right click on the query name and select Duplicate.
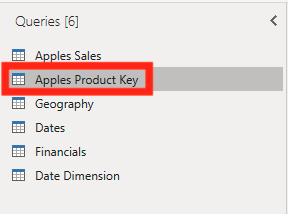
Now rename your new query to Product Key.
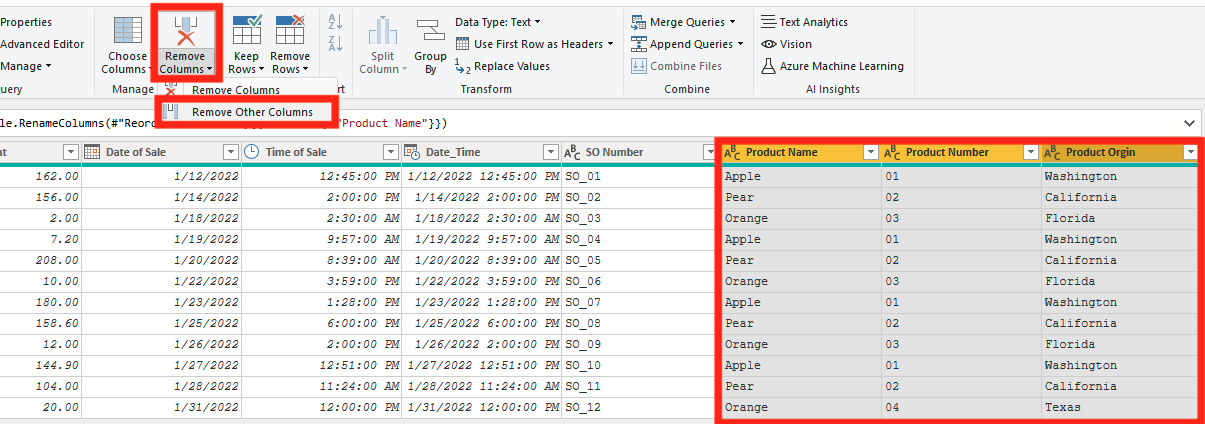
In our Product Key table, we can remove all the columns that aren’t related to each of the specific products. I am removing Everything except for my Product Name, Product Number, and Product Origin.
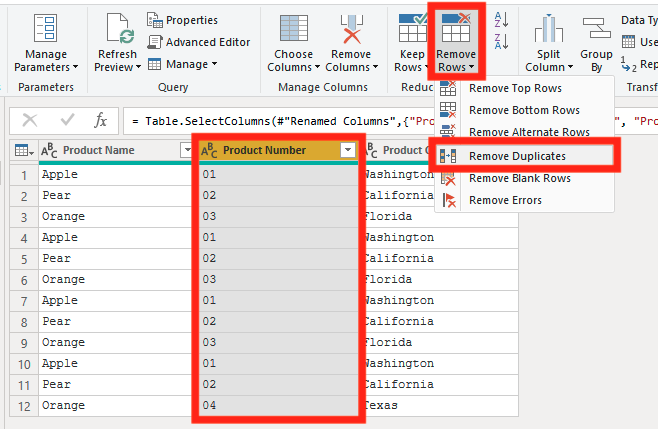
Now we are going to do a remove duplicates on the Product Number. This will remove any Product IDs that are repeated in the data set. This step is important to do because it allows for a One-to-Many relationship. If you don’t do this, you will have a Many-to-Many relationship as described in the Common Problems section above.
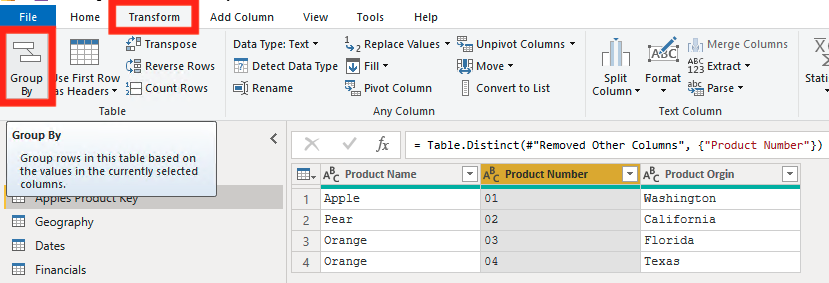
Now we are going to do a Group By to make sure that we don’t have any duplicates in our semantic model. To do this go to Transform and click on Group By. Then we are first going to do a count of our Product Number.
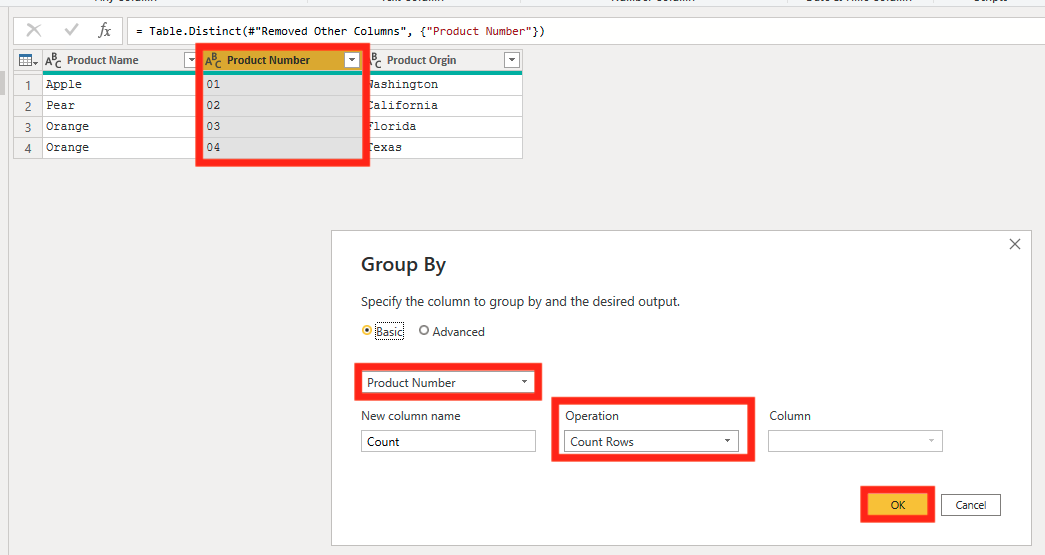
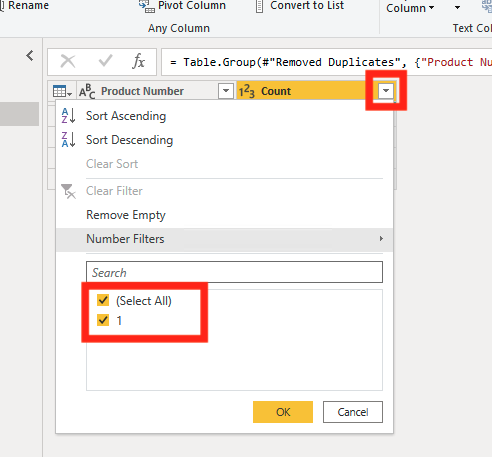
To make sure that there aren’t any duplicates, click on the dropdown in the Count Column, then select Load More if possible (I have a smaller semantic model, so my Data is all loaded). Then if you only see a “1” you are good to go, but if you see anything other than “1”, filter by that number and start troubleshooting and try removing duplicates on the semantic model again.
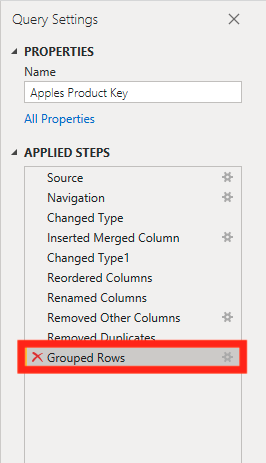
Now we can remove the step by clicking on the “X” in the applied steps.
If you want, you can also group by the name to see if there are any products with the same name. This may become important later when you are creating graphs and you want to use the product name.
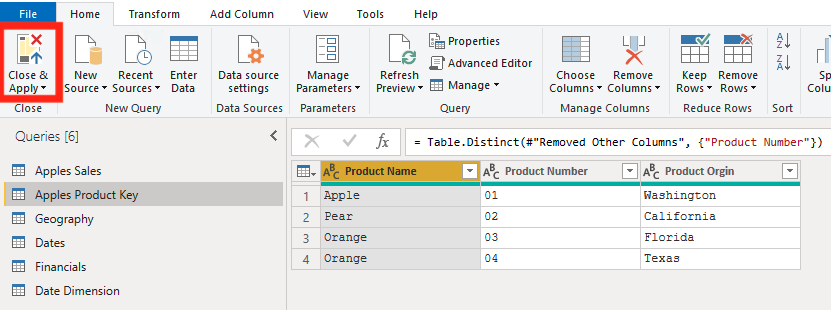
Once we have checked that our Product Key has all the columns that we want, we can hit Close and Apply.
Now you can use this field to create relationships between. If you want to see how to do that you can read the EPM Blog about Basic Relationship Building.
Conclusion
Row Specific Columns are a must have in any report and allow for so many more combinations of data through relationships. If you don’t already have a key built or your data, the walkthrough examples are great to use, and if you do, understanding the abilities of your data becomes very important when using Power BI Desktop.
Comments
5 Responses to “ Power BI Row Specific Columns ”
[…] Power BI Row Specific Columns : :: Welcome To EPM Strategy :: […]
[…] Power BI Row Specific Columns : :: Welcome To EPM Strategy :: […]
[…] Power BI Row Specific Columns […]
[…] Row Specific Columns […]
[…] Row Specific Columns […]
Leave a Reply
You must be logged in to post a comment.