The Differences Between Creating a Report on Power BI Service VS. Desktop
By: David Rohlfs
Introduction
Like many other functions in Microsoft, you can create a report in two different ways. The first being on the desktop app; this is where you will likely create most of your reports. The second is on the Power BI service; this is done through the internet and doesn’t require the desktop app.
In this blog we will go through when to use either the desktop app or service for creating Power BI reports, some common problems you may encounter when creating a report, and a walkthrough of how to set up a report on the service.
When to use it
Since we are going to compare two different concepts, I want to focus on the pros and cons of each. While looking at the two options, they both seem to be very similar, but there are a few important differences that we will be focusing on in this blog. If you do not already know, by service I mean App.PowerBI.com.
Desktop Pros:
- Functions on the desktop are smoother (work better). Working on the desktop is the most common form of report building, and because of it many of the functions and abilities are focused on the desktop app.
- You get to use Power Query. This is the biggest con to using the service because the Power BI service doesn’t allow you to use power query. When you work with Power BI and with data, the most time-consuming part can be cleaning and understanding the semantic models. And if you don’t have power query to do this, you may be challenged before you even get to start building your report.
- Less lag time. Another pro of working on the desktop app is that you are working locally. This means that if you move a visual or change a field, there is little to no lag time.
Desktop Cons:
- MacOS does not support Power BI. There are not many cons when working with the desktop app, but the main one is that you need windows to run Power BI. I originally started my reporting career working on a mac. This was possible because I was connecting through a remote computer, and it worked but was not ideal. If you intend on using a mac to create reports, you may find that working on the Power BI service is best for you.
Service Pros:
- Reports are always accessible. The best part of working on the Power BI service is that if you have internet, you’ll be able to get to your reports. This is great especially if you are on a computer that isn’t suited for running Power BI or doesn’t have the Power BI app in the first place. You may find this helpful if your organization doesn’t allow you to download Power BI as well.
- You can work with others. If the workspace that you are creating the report in allows for multiple users to work on the same report, you can collaborate on one report without sending a file back and forth.
Service Cons:
- There is no Power Query. This is the biggest setback with working on the service. When you don’t have power query you need to have clean data come in. You can avoid this by using a dataflow, but you should recognize that when building reports in the service, there is no power query option.
- There is no DAX. Unfortunately, there is no DAX available when working on the service. DAX allows a report builder to do many simple and complex equations that can help to form your data in a way that helps your end user read the report.
Common Problems
The most prevalent common problem that I see when creating a report on the service is that you need to be able to access your data on the service. There are a couple of ways that you can do this. The first is that you publish a semantic model. This seems odd because you can use the desktop app to do this, but if you are working away from your computer, then doing this while you are able could be a solution. The second way is that you use a dataflow. This option is my favorite because it still allows you to use power query while you are building your dataflow. There are also a few more advantages to using a dataflow in general that we won’t be able to get to in this blog, but they are worth looking into if this would be your preferred method of creating a service only report.
Walkthrough
In this walkthrough we are going to focus on the service side because that is generally the method that most report builders are less experienced with. We are also only going to cover building a report on the service using a pre-existing semantic model. This is because we are going to save dataflows as a future blog of their own.
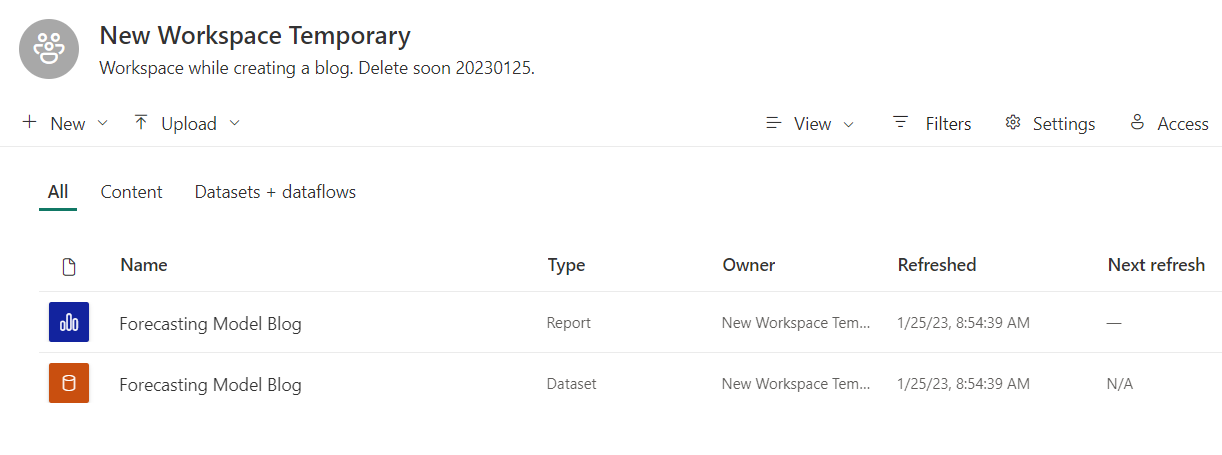
To start you need to go to App.PowerBI.com. This will bring you to the home page. Then you can either create a new workspace or go into a pre-existing workspace. You can find the workspace at the bottom left side of your screen.
This is where you will need to decide if you are going to use a data flow or other semantic model (read Common Problems above).
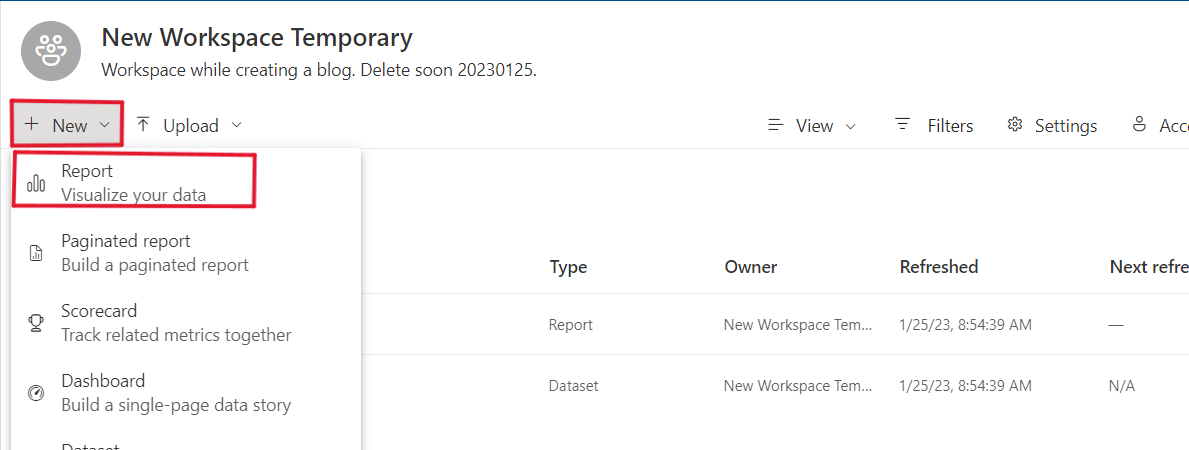
Now we can go ahead and click on the +New dropdown in the top left corner and select Report.
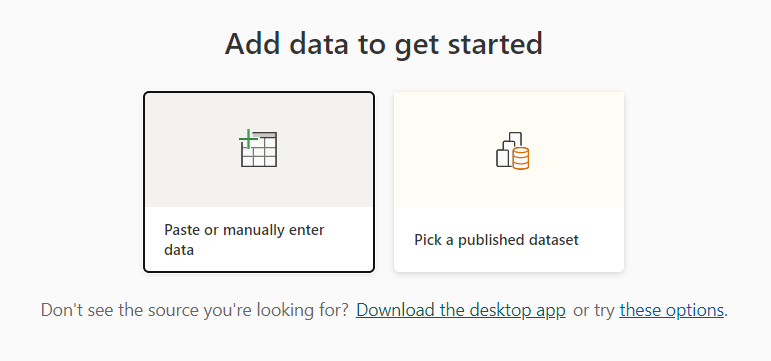
In this page you can pick to paste or manually enter data or to pick a published semantic model. For this blog we are going to go with a semantic model.
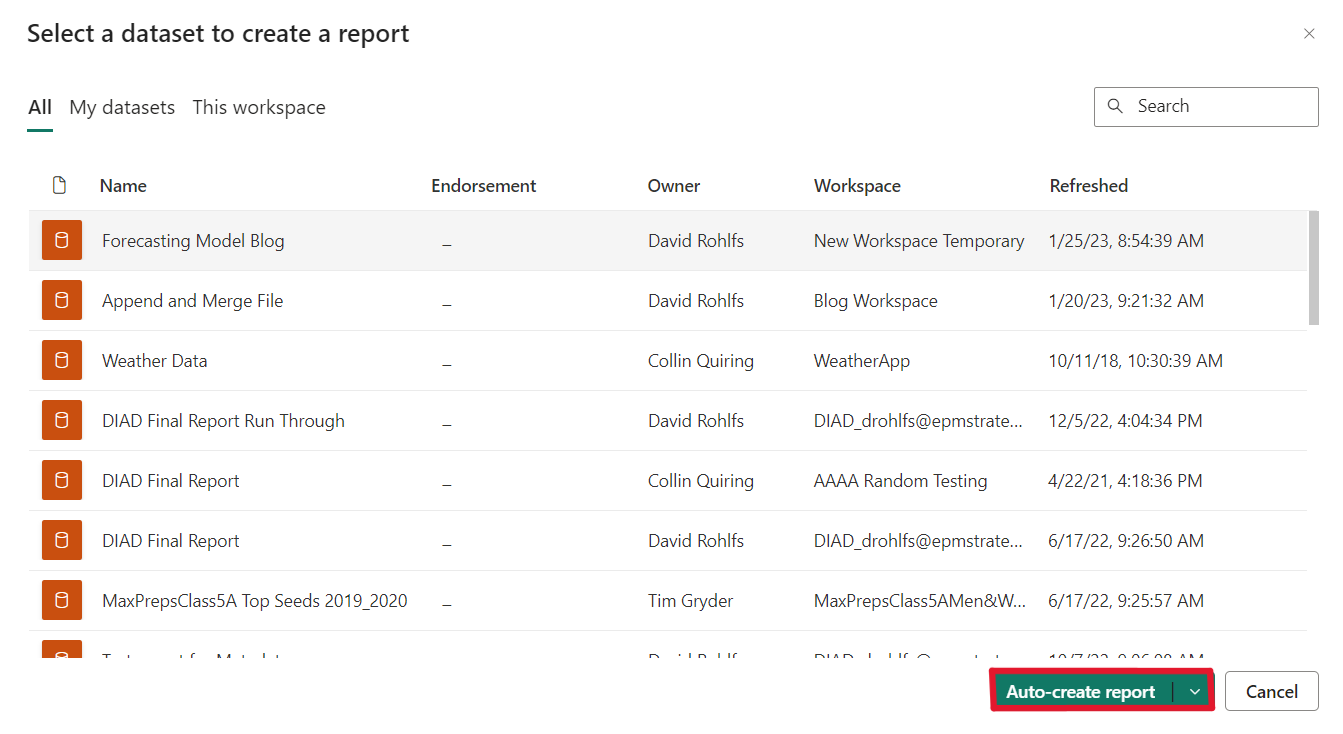
Now we get to choose which semantic model we want. This page will show you all the semantic models that you have access to and some that are only yours by using the filters in the top left. When you click on a report you will see that you can either auto create a report or create a blank report. I prefer to create blank reports so that I can build my own report, but you can do whichever you would like.
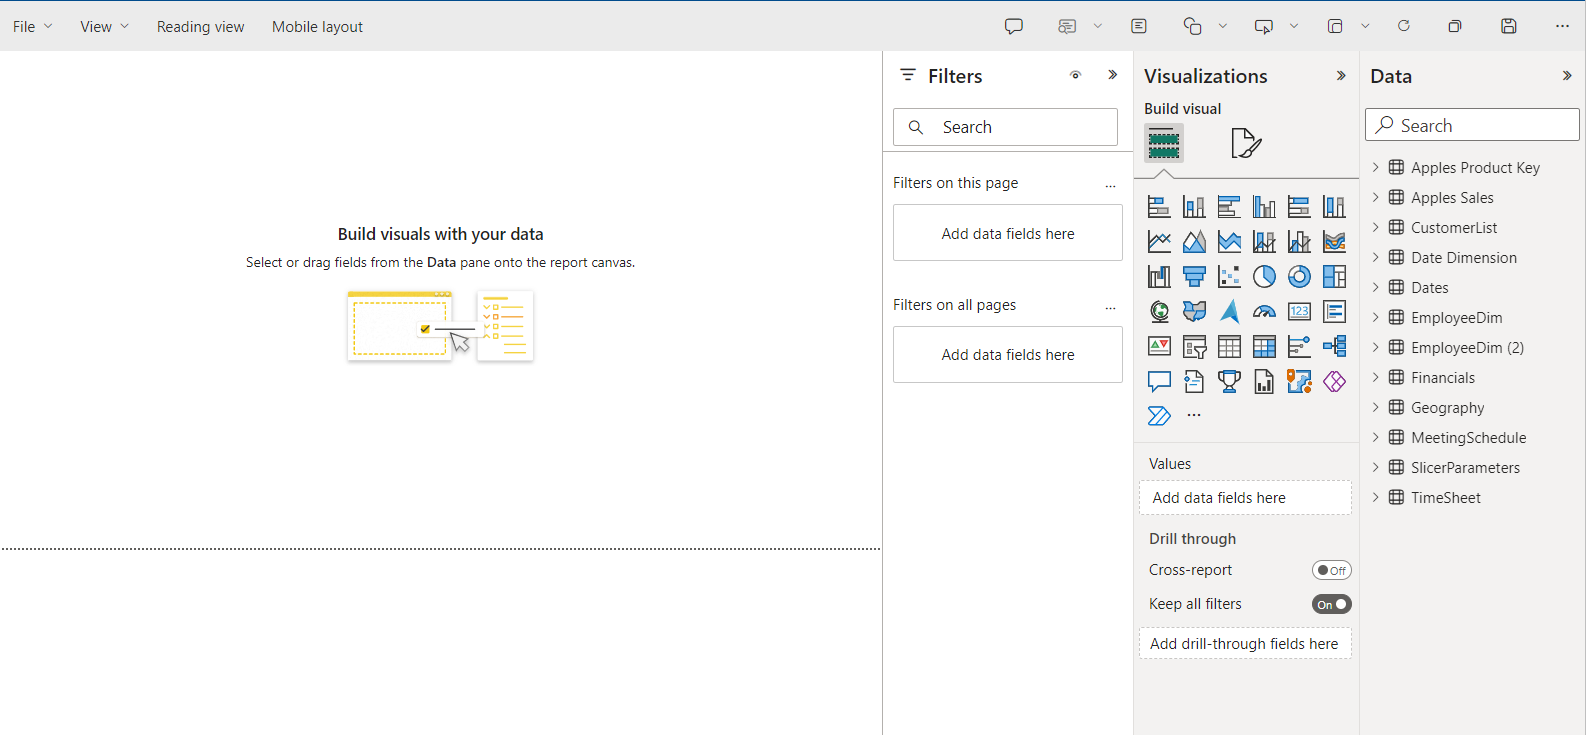
Next, you will be brought to your report building page. This will look like the desktop app except that you do not have power query and you aren’t able to create DAX equations. From here almost everything else is like the desktop app, so you can go ahead and build your report.
Conclusion
Fortunately, Microsoft gave us a few ways that we can create Power BI reports. Having these two options lets us pick and choose how we want to work with our report according to the abilities that we have. I hope that this blog gave you an understanding of why you may want to choose to create a report on the Power BI service or on the desktop app, and if it did, please check out some of the other blogs posted on EPM Strategy’s website!
Comments
One Response to “ The Differences Between Creating a Report on Power BI Service VS. Desktop ”
[…] The Differences Between Creating a Report on Power BI Service VS. Desktop […]
Leave a Reply
You must be logged in to post a comment.