Power BI Hierarchical Slicers
BY: David Rohlfs
Introduction
Hierarchical slicers are a great way to enable a report builder to simplify their slicers and to simplify their report. Hierarchical slicers allow for a field to be subcategorized under another field. This allows the report to acquire a cleaner aesthetic with less slicers and for the report to be simplified.
This blog will go through talk about when to use Hierarchical slicers, common problems that you may see, and walk you through two examples of how to use a Hierarchical slicer.
When to use it
Hierarchical Slicers are very useful and can help to simplify your report drastically. They allow the report builder to stack selections in slicers so that one field is under another broader field. You will commonly see a Hierarchical slicer containing date fields, but they are extremely helpful for many other common fields.
Creating a Hierarchical slicer is a common practice to use in many situations. It can be very helpful when a slicer contains:
- Dates
- Product/Sales numbers
- Geography
- Categories and Sub-Categories
- With Department Specific Information (Look at Walkthrough Example 2)
Common Problems
For the most part Hierarchical slicer have very few bugs associated with them. For that reason, the two common problems explained below are associated more when you are creating your own table (Used for Walkthrough Example 2).
Duplicated Aggregation
When copying and pasting the formula from example 2 into Power BI, I did see an error where Power BI tried to duplicate my aggregation at the start of my equation. It is easy to recognize and all you need to do is to delete the duplicated portion of the formula.
Retyping Quotations
When copying and pasting into Power BI one thing that I found was that Power BI doesn’t always recognize your text. It is very simple to diagnose because your formula just won’t work, and you just need to retype a couple of things into the equation. The only thing that I found this true for in the equation for example 2 was the quotation marks. All you need to do is retype them once you are copying and pasting the formula into the custom column pop out.
Walkthrough
To explain how to use a Hierarchical slicer we will go through two examples. The first one will be a simple example where we show a slicer with a year and a month. The second example will show you how to create a custom column that will help to organize your slicers and data. Finally, we will show how to enable and disable multiple selections for a slicer.
First Example
In this example we will create a Hierarchical slicer that represents year and the months in it. To do this we will follow these steps:
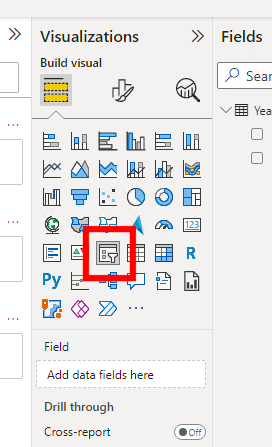
After loading the data, you will want to select the slicer option in Visuals.
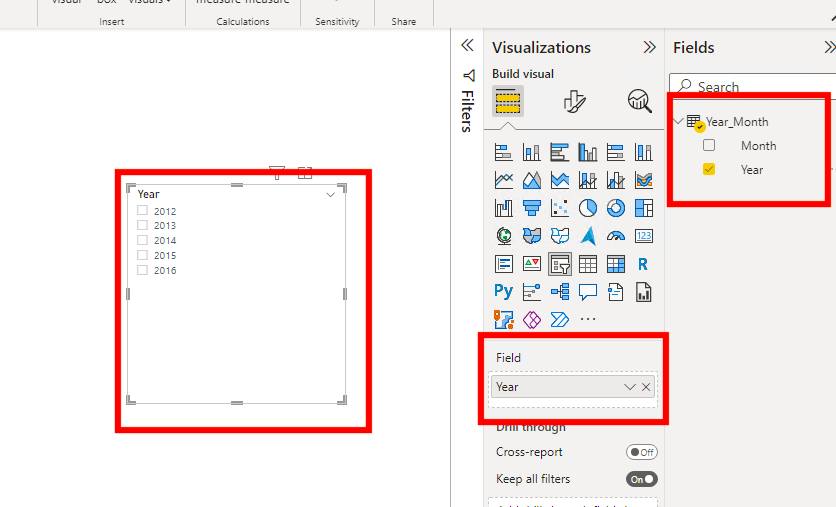
Next you will want to grab your year data field and place it into the fields option.
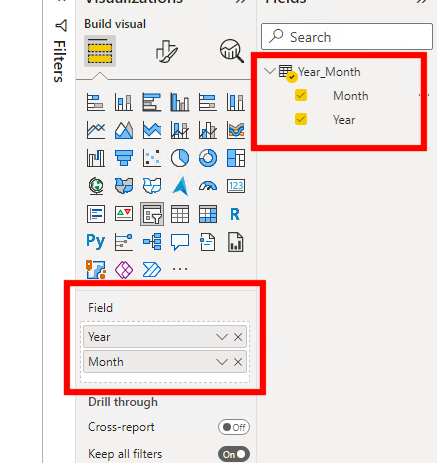
After that, grab your month and place it underneath the year in the fields list. You should see a yellow line when placing the new field into the fields list. This will tell you where Power BI is going to put the new field.
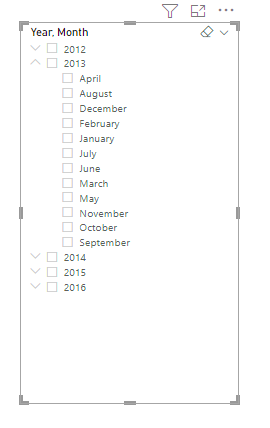
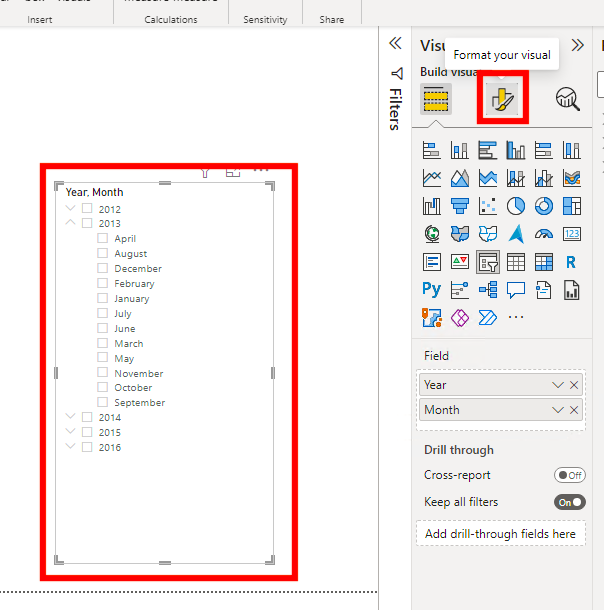
Now if you click one of the down arrows in your slicer you should see all the months for a year show up.
Second Example
In this example I will be showing you how to create a custom column to use in a Hierarchical slicer. This example is to show you how to create a field that isn’t in the data but is helpful to present your data. Creating this new column can be very helpful if you have a product, price, subcategory, region, etc. that you want to group in a way that makes sense to your industry or organization. For example, if I wanted to group a product by a seasonal category, or a month by a quarter, or a price point by a range of prices.
To do this we will be going into the power query and creating a new column with our custom data. For this method you will need to know what product number is the lowest in each of your custom categories.
In this example I am creating a custom category for each of my products using a query that is listing my products and the product key as my reference field.
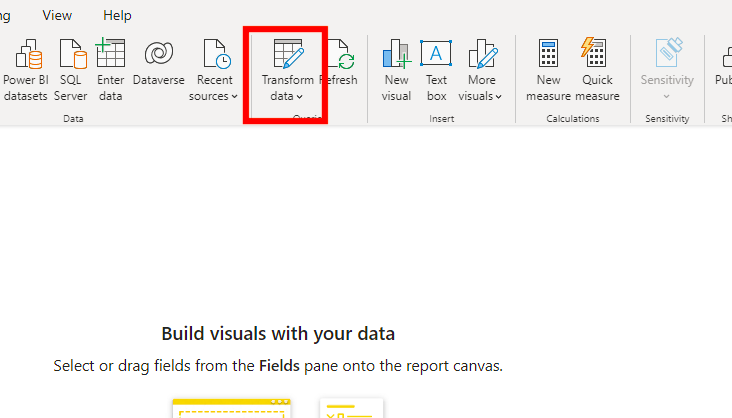
After we are in Power BI and have loaded in our data, we want to go to the Power Query.
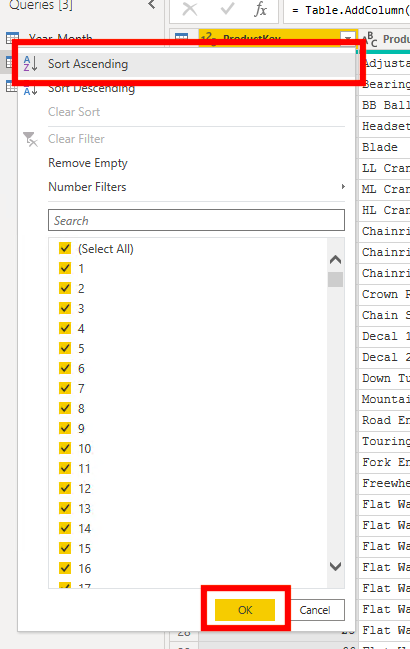
For this example, I am selecting the “sort ascending” button in the arrow next to the reference column then clicking Okay. This will help make sure that the data is in order before I enter the formula. (This step is optional but advised for a situation like this example.)
Now we can click on Add Column in the top ribbon and select custom column.
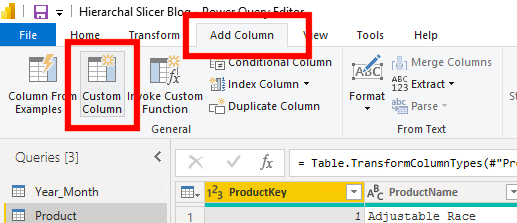
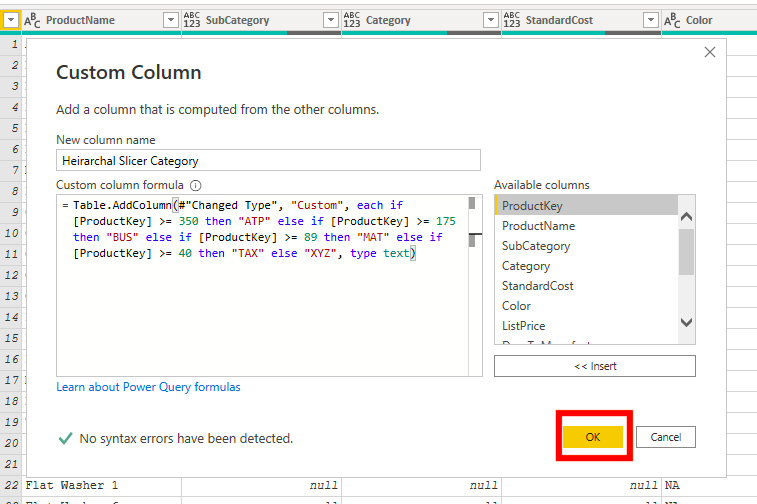
This will bring you to a pop out window where we will enter our data and create our formula and name our new column. Make sure that your reference column is selected in the “Available Columns” selection in the Pop Out. The text for the formula that I used is below.
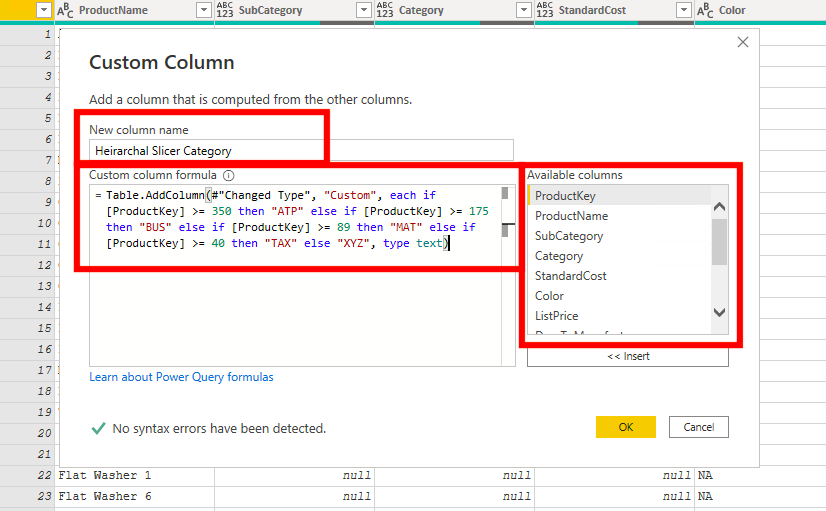
This is the formula that I am using for this example.
= Table.AddColumn(#”Changed Type”, “Custom”, each if [Enter Reference Table] >= Enter Min Reference Data then “New Name” else if [Refence Table] >= Enter min reference data then “New Name” else “Final New Name”, type text)
Explanation of Formula:
- For this Formula you will need to enter the column name that you will be referencing for the Enter Reference Table.
- Enter the minimum value that you will use to determine separate your data in the Enter Min Reference Data.
- Enter the name that you want to use for the section of data for the New Name.
- In the name that you want for the Final New Name. This will choose any data that has not been specified, aka the data min value to the lowest stated value.
- To add more sections to this formula just repeat the else if [Reference Table] >= Enter min reference data then “New Name” Do this before the final else “Final New Name” .
- The word “text” at the end is the type that your Enter Min Reference Data is. Text should work for most situations, but if you encounter an error with the formula, you may check this.
- If you do copy paste this formula into Power BI, then you will need to retype the quotation marks, or else your formula won’t be valid.
- Make sure that you get the No Syntax Error Have Been Detected at the bottom of the pop out.
For the example that I used in my formula I had a numerical number as the Enter Min Reference Data, but you can use text, numbers, and text with numbers.
This step looks very intimidating, but it is just a repeating formula and is very simple. You can copy the formula above and do it this way, or if you can use a column from examples (See article Column From Examples. If you know how to create formulas, I suggest using the custom table because that will allow you to have full control over what you are doing with the data.
There is a common error when creating your own custom table with copying and pasting. If this happens check the common problems section above.
Once you enter the formula you can click OK at the bottom of the pop out.
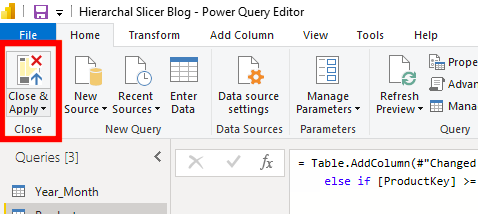
Now you can click close and apply in the top left of the ribbon.
Now we just need to create our slicer with our new column. (It will be the same process as the first example).
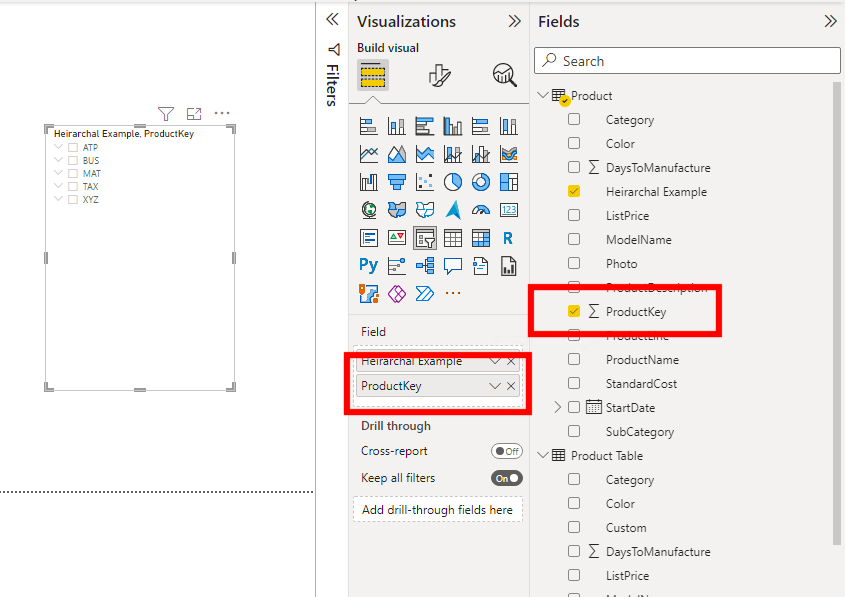
You will want to select the slicer option in Visuals.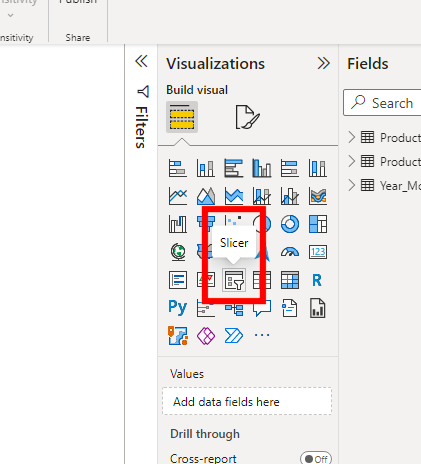
Next you will want to grab your new column field and place it into the fields option. This could be different for you depending on your purpose for the new column.
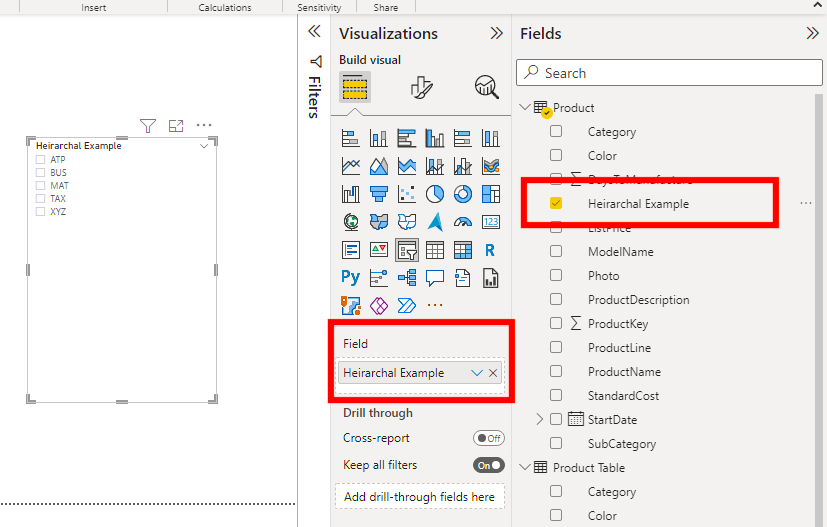
After that grab your product key and place it underneath the year in the fields list. You should see a yellow line when placing the new field into the fields list. This will tell you where Power BI is going to put the new field.
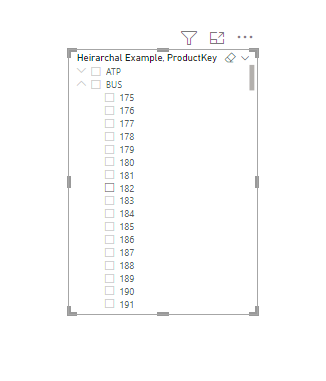
Now if you click one of the down arrows in your slicer you should see all the product keys for a category show up.
Remember, Power BI has many ways of doing the same thing, if this method doesn’t work for you for any number of reasons, there are many other ways of solving this same problem.
Multiple Selections
It is a common need that the report builder only wants to allow the end user to be able to select one option from the slicer. This process will work with a normal slicer as well as a Hierarchical slicer. To represent this, we will use the slicer from the first example.
First you want to make sure that your slicer is selected. Then you can click on “Format Your Visual” at the top of the Visualizations bar.
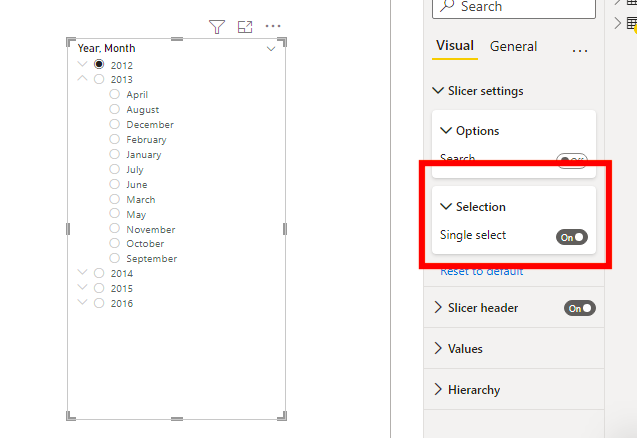
Now you can click on “Slicer Settings” and “Selection”

In “selection” there are multiple options of what you can choose. You can choose to have single select, to use the Control key to multi-select, and to show the select all option for your end user.
The best way to learn what they do is mess around with them, but in this example, we will just select “Single Select”.
These are just a couple examples of what you can do with a hierarchy in your slicers. Using a hierarchical slicer allows you to group logically related items in one spot for your users.
Comments
2 Responses to “ Power BI Hierarchical Slicers ”
[…] Power BI Hierarchal Slicers […]
[…] Power BI Hierarchical Slicers : :: Welcome To EPM Strategy :: […]
Leave a Reply
You must be logged in to post a comment.