Power BI – DAX Running Totals
By: David Rohlfs
Introduction
I recently came across a problem where the end user wanted to see data that was 3 weeks before today and three weeks after as a running total. Naturally, I took on the problem and found myself thinking about all the possibilities for this situation. One thing that has been very apparent to me about being able to work with different companies as a consultant is that you will always find someone who wants more control over the data in their reports. Because of this I took this original problem to the next level and gave all the power to the end user.
This blog will partially be building off of the What If Parameters blog by EPM Strategy (linked below).
In this report I will go over a few related topics. The first will be over running totals in DAX. The next will be over running totals within a set period like month, quarter, and year. Finally, I will use what if parameters to set your fixed date and number of days, weeks, months, and years.
When to use it
Running totals are a very normal need in reporting, but there isn’t a pre-built DAX function that has the functionalities like what you can create with custom equations. Creating a running total in DAX can be a little daunting because an end user will generally expect a running total to follow the current grouping requirements of the other sales amounts and groups. This could be like restarting a running total every time there is a new Date, Product, SKU, etc. I will help you go through the process of creating a basic running total, a running total that has groupings, and a running total that has full dynamic ability for the end user.
Running totals are amounts that sum all of the sales up to a specified point. Generally, a running total will sum the sales up to the date and time of the current sale. But you can take this a step further and create running totals for specified amounts of relative times. Like creating a running total for the last three months, or the surrounding 6 weeks. This is where the creation the third example that has fully dynamic date ranges was created.
Running totals will follow the slicers if the running total is created inside of a measure. The most common method to use a running total is with the first method in the walkthrough where you create a running total for the entire table then use slicers to fine tune the dates you or the end user want the running total on.
Walkthrough
I am going to split this walkthrough up into three different parts. The first will just cover running totals using DAX, the second will do running totals within a set time frame like month, quarter, and year, and the third will go over the dynamic use of what if parameters inside of your page. Because there will be some complex DAX use, I will post the DAX equations into their own section below.
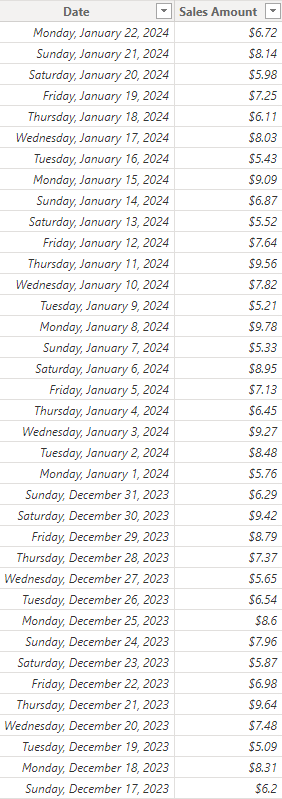
We will start by looking at our fact table. This table has the sales amount and the date of sale.
Let’s start with the first example and create a running total for the entire set of data. I will use Equation 1 from the DAX equations and place this into a measure.
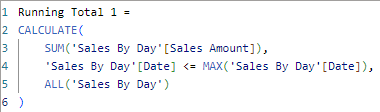
With this inside of our fact table, you can notice that the running total will go until it finds the end of the table visual. If we add a date slicer, we can create the date ranges that the running total occurs. Notice that the running total is still based on the entire Sales Fact table.
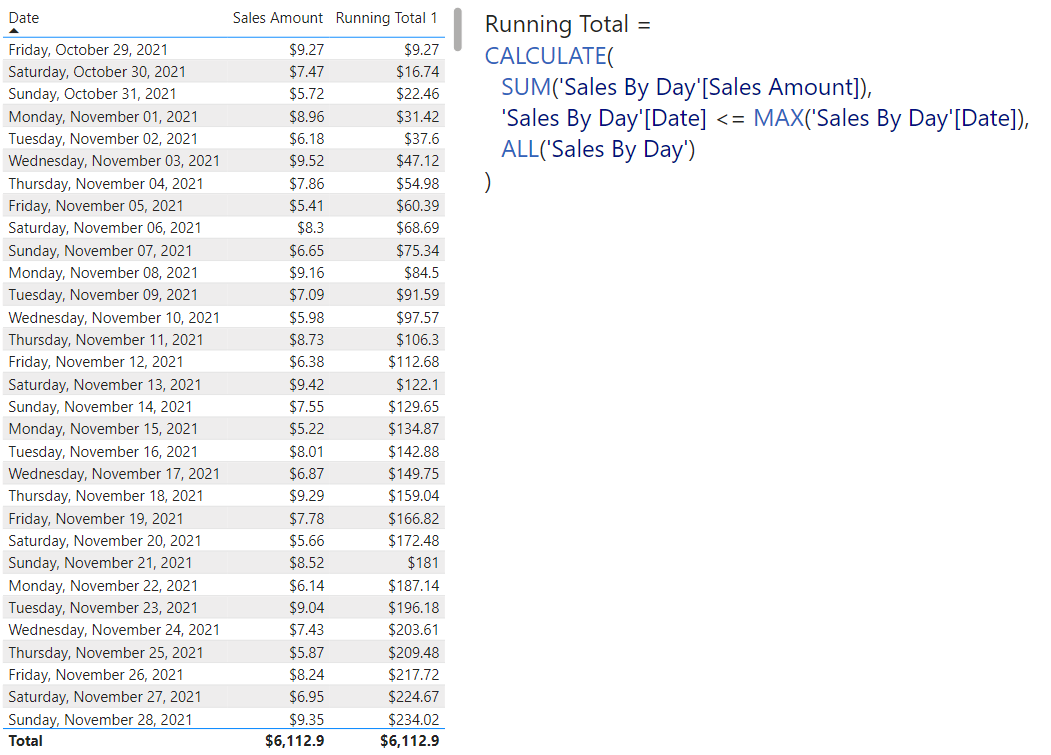

Let’s go onto the second example. I am going to be using the DAX Equation for Equation 2 in this scenario. I am starting with the same sales table but now I want to get my running totals to restart every month. I created the DAX equation so that you can use the Switch variable to change between the running total restarting every year, quarter, month, or week. The base equation is similar to Equation 1, but we are using some extra filters to account for the restart points.
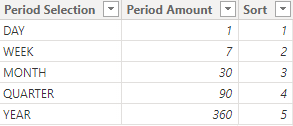
Finally, let’s talk about our third example. The equations will be looking at several what if parameters and also a supplementary table. There will be helpful blogs linked below to explain each of these concepts. Using what if parameters allow us to give the end user the option of exactly what date and how many days, weeks, months, quarters, and years the running total will be calculated on. It is likely that you will never use this exact example, but using the equation to base your amounts on can be helpful.First, we are going to talk about the supplementary table. My goal is to create a slicer that can be used by the end user to choose between how many days, weeks, months, quarters, and years. I am just going to use the enter data ability to create this table. I also have a second column that is a number saying how many days each of the options are.
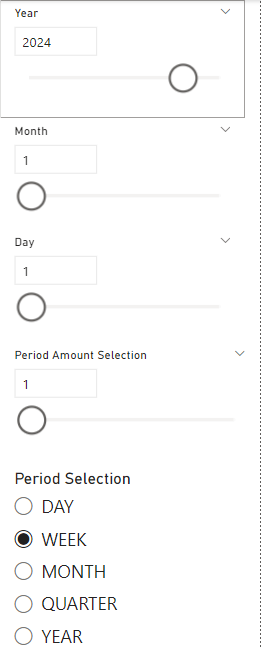
Now lets create all of our What If parameters. I a going to create four of these. The Year, Month, Day, and Number of Periods. The year, month, and day are just to give the end user an option to change the date. It is more likely that you will just use a date slicer from an existing date field. I will follow the process described in the blog What If Parameters linked below.
Now let’s plug in our DAX equation into a measure. I am going to use the Equation 3 from below. Notice that the process is similar to Equation 2, but we are creating bounds for our data as well. Here is my final result:
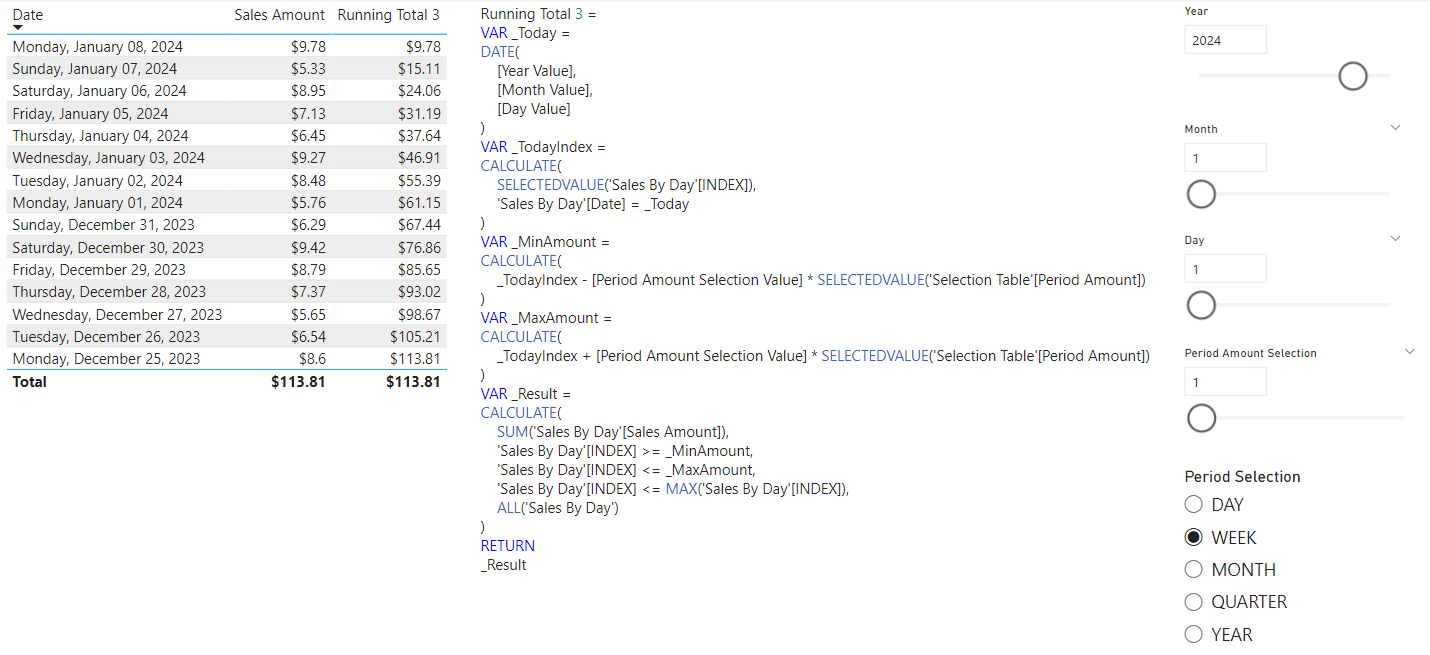
I am able to allow my end user to choose the key date, the period, and the number of periods for the running total to calculate on.
DAX Equations
Equation 1 =
CALCULATE(
SUM(‘Sales By Day'[Sales Amount]),
‘Sales By Day'[Date] <= MAX(‘Sales By Day'[Date]),
ALL(‘Sales By Day’)
)
Equation 2 =
VAR _SWITCH = “Month”
VAR _YEAR =
CALCULATE(
SUM(‘Sales By Day'[Sales Amount]),
‘DateDim'[DateField] <= MAX(‘DateDim'[DateField]),
‘DateDim'[Year] = SELECTEDVALUE(‘DateDim'[Year]),
ALL(DateDim))
VAR _QUARTER =
CALCULATE(
SUM(‘Sales By Day'[Sales Amount]),
‘DateDim'[DateField] <= MAX(‘DateDim'[DateField]),
DateDim[Year] = SELECTEDVALUE(DateDim[Year]),
DateDim[Quarter] = SELECTEDVALUE(DateDim[Quarter]),
ALL(DateDim))
VAR _MONTH =
CALCULATE(
SUM(‘Sales By Day'[Sales Amount]),
‘DateDim'[DateField] <= MAX(‘DateDim'[DateField]),
DateDim[Year] = SELECTEDVALUE(DateDim[Year]),
DateDim[Month] = SELECTEDVALUE(DateDim[Month]),
ALL(DateDim))
VAR _WEEK =
CALCULATE(
SUM(‘Sales By Day'[Sales Amount]),
‘DateDim'[DateField] <= MAX(‘DateDim'[DateField]),
DateDim[Year] = SELECTEDVALUE(DateDim[Year]),
DateDim[Week of Year] = SELECTEDVALUE(DateDim[Week of Year]),
ALL(DateDim))
VAR _RESULT =
IF(_SWITCH = “Year”, _YEAR,
IF(_SWITCH = “Quarter”, _QUARTER,
IF(_SWITCH = “Month”, _MONTH,
IF(_SWITCH = “Week”, _WEEK
)
)
)
)
RETURN
_RESULT
Running Total 3 =
VAR _Today =
DATE(
[Year Value],
[Month Value],
[Day Value]
)
VAR _TodayIndex =
CALCULATE(
SELECTEDVALUE(‘Sales By Day'[INDEX]),
‘Sales By Day'[Date] = _Today
)
VAR _MinAmount =
CALCULATE(
_TodayIndex – [Period Amount Selection Value] * SELECTEDVALUE(‘Selection Table'[Period Amount])
)
VAR _MaxAmount =
CALCULATE(
_TodayIndex + [Period Amount Selection Value] * SELECTEDVALUE(‘Selection Table'[Period Amount])
)
VAR _Result =
CALCULATE(
SUM(‘Sales By Day'[Sales Amount]),
‘Sales By Day'[INDEX] >= _MinAmount,
‘Sales By Day'[INDEX] <= _MaxAmount,
‘Sales By Day'[INDEX] <= MAX(‘Sales By Day'[INDEX]),
ALL(‘Sales By Day’)
)
RETURN
_Result
Conclusion
Running totals are a little complex and hard to build yourself, but they are very important to understand the amount that is being taken in at each point. Hopefully you enjoyed this blog; I know that there are some advanced concepts in Examples 2 & 3, but all of the concepts are described in better detail below in the Related Blogs. If there was something that you want to learn more about, I have linked several other EPM Strategy blogs below that you should check out!
Links Related to This Blog:
Comments
Leave a Reply
You must be logged in to post a comment.