Power BI Filters VS Slicers
By: David Rohlfs
Filters and Slicers are two commonly used features in Power BI Desktop. Because of the characteristics of filters and slicers, they have many common uses which are quite similar for the report builder. The main reason to choose the use of one or the other is for the experience of the end user. Slicers are used on the report page and are seen and accessed by the end user. Generally speaking, filters are not seen by the end user – unless you have given the user Build permission.
The filter:
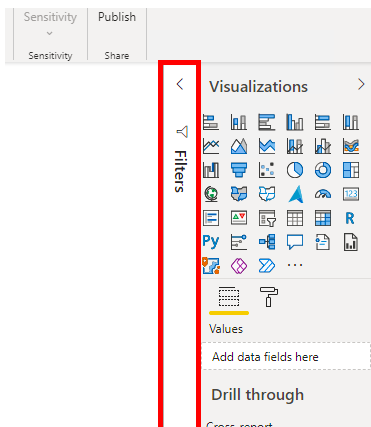
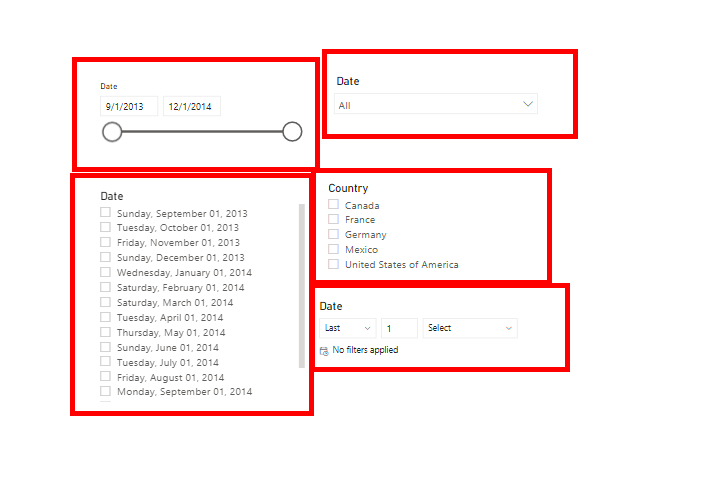
The slicer:
![]()
Filters and slicers in Power BI both accomplish many of the same goals for the report builder. Many of their similarities include:
- The ability to exclude data from a model
- The ability to set a range of dates that a model presents
- The ability to customize data inside of a report
These differences make it very useful to deliberate between data if you are building a report with an unwanted section of data.
Filters
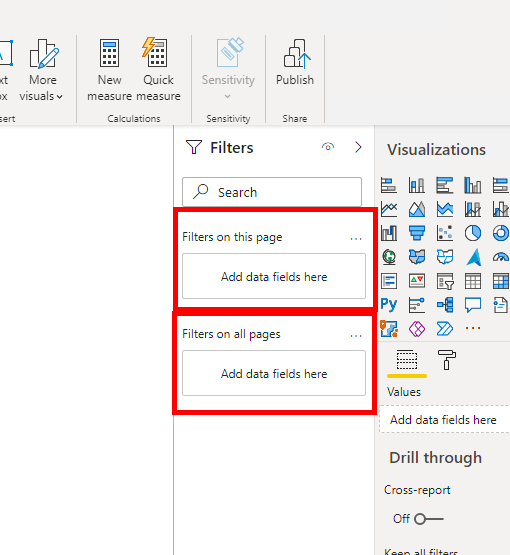
Filters have many abilities in between Basic Filtering and Advanced Filtering. Filtering is best used for the report builder to show certain part of the data such as region, product, or date. This feature is very helpful if the report builder wants to emphasize a specific area of the data in the report. The report builder also can distinguish between filtering on a single page or all pages.
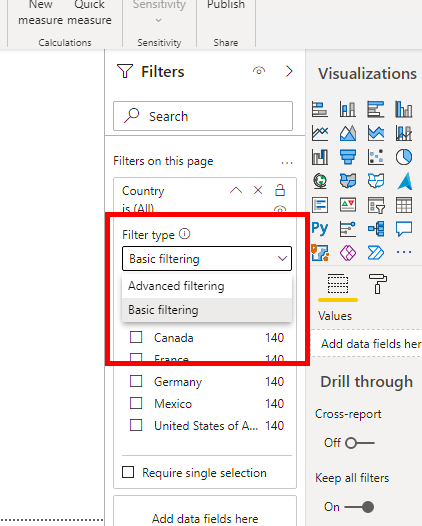
Basic Filtering
In the basic filtering, the report builder can use it much like a slicer, except for the ability of the end user to choose the selection. This can be very helpful for ease of use and choosing specific areas that the end user would like to focus on.
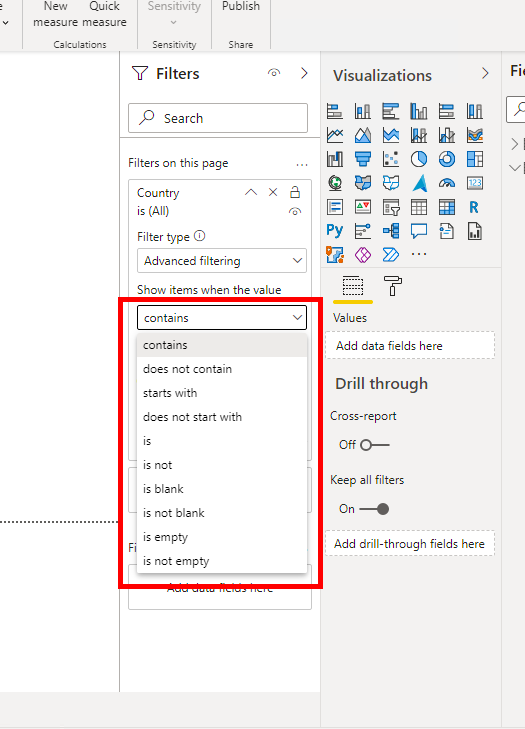
Advanced Filtering
Advanced filtering is more complex but has many more uses for the filters tab in Power BI Desktop. Advanced filtering can filter through values with the distinction of:
- Contains
- Does not contain
- Starts with
- Does not start with
- Is
- Is not
- Is blank
- Is not blank
- Is empty
- Is not empty
These distinctions allow the report builder to decide how they would like to filter the data and be more precise with their output to the end user.
Slicers
We prefer to use Slicers to allow the end user to determine how they would like to separate their data. This feature allows for the ability to pick and choose what data will be represented from choices of date, region, country, product, sales size, price, etc. While slicers are directed towards the use of the end user, they can become very helpful to the report builder so that there is a distinction and ability to check that the data appears correct.
A lot of the time the report builder will use slicers to allow for a large amount of data on the page, and still be able to access more specific details within the data set. This can be very helpful to the end user because it allows for the customization of the page while not needing to contact or refer to the report builder.
Slicers have many of the same abilities as the basic filters, but with the ability for the end user to change and decide what categories or selections they want to concentrate upon.
Slicers can be demonstrated through many different visualizations such as:
- List
- Dropdown List
- Between
- A Relative Date or Time
Let us know if you have any comments or thoughts!
Comments
2 Responses to “ Power BI Filters VS Slicers ”
[…] sorts of things. In the past, EPM Strategy has covered some of the advantages of creating a slicer (Filter vs. Slicer), and how to create a Hierarchal Slicer. Considering these past blogs, this blog will assume that […]
[…] Power BI Filters VS Slicers : :: Welcome To EPM Strategy :: […]
Leave a Reply
You must be logged in to post a comment.