Power BI – Visual Calculations
By: David Rohlfs
Introduction
Maybe you have heard of this and maybe you have seen others use it, but visual calculations are a preview feature (as of writing this blog) in Power BI desktop. Visual calculations allow the developer to simplify their code writing by focusing on final values and not row values.
Visual calculations are still a very new feature in Power BI and there is a lot that you can do with them that is unknown to most users. But this blog will aim to focus on the basic use of a visual calculation and hopefully give you a good introduction to the feature.
In this blog we will go over visual calculations and do a walkthrough showing you an example of creating a visual calculation.
When to use it
Visual calculations are most useful when you want to do a calculation on a specific visual alone and want the amounts for the calculation to pull directly from the visual. The second part of that sentence is the important part of the process behind understanding visual calculations. The values are not pulled from the originating table(s) and combined to fit the categories for the visual (like normal DAX measures and columns), but instead the values are pulled from the visual and calculated there. This will make more sense when we go through our walkthrough.
One of the nice things about visual calculations is that you can create very specific use calculations. For example, you want to create a variance of two numbers and multiply it by a preset value. Normally this would start to require lots of lines off DAX code (and you can still do it this way), but you can do a visual calculation that instead manually plugs in that amount. Basically, you can start to get very specific with your use and values when you get into using visual calculations.
There are also several new functions made just for visual calculations. Because visual calculations pull numbers from the visual and not the table, there are new functions that take advantage of this attribute. It isn’t uncommon that while using DAX you need to come up with complex formulas to do simple tasks that excel could do. This gap is bridged with visual calculations. A running sum is a prime example of this. In DAX you would need to use a slightly complex formula to create a running sum, but with visual calculations you just need to plug in the function.
Here is a link to the Microsoft Learn website that contains all of the information on Visual calculations (including added DAX functions):
https://learn.microsoft.com/en-us/power-bi/transform-model/desktop-visual-calculations-overview
Walkthrough
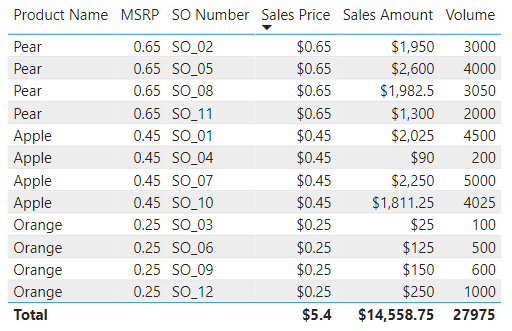
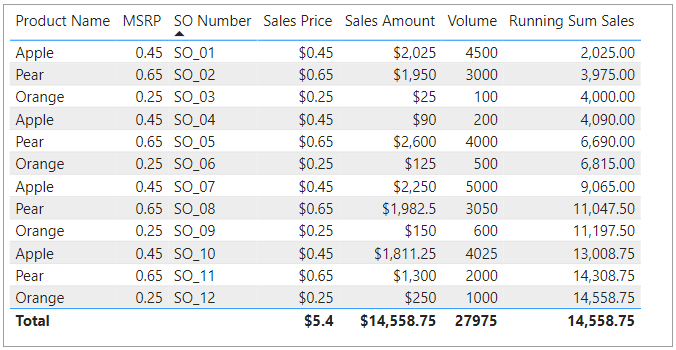
In this walkthrough my goal is to create a running sum of sales from a table on my report page.
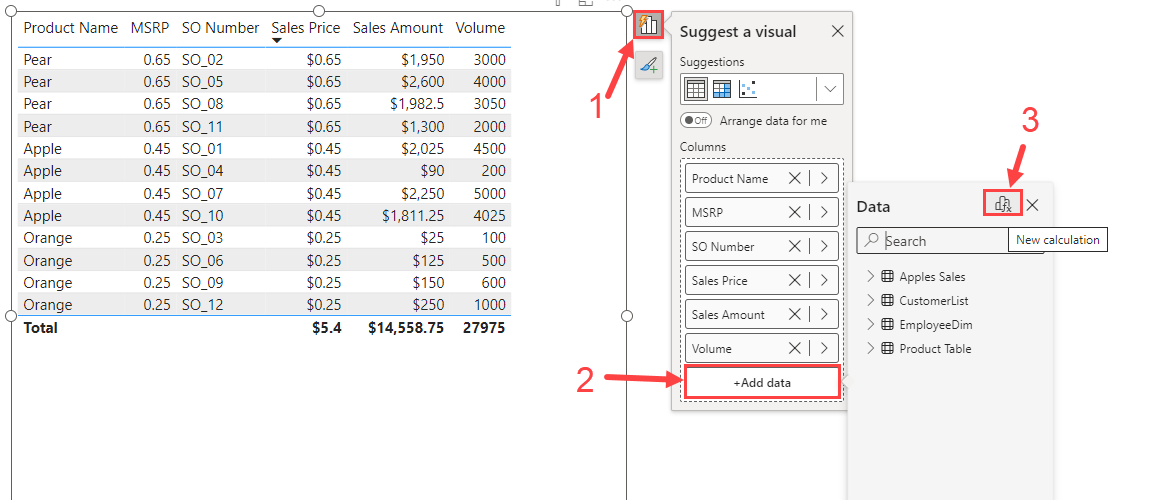
Let’s go to the Build a Visual tab and select the “+Add Data” button. In here we can click on the “fx” button at the top right of the pop-out.
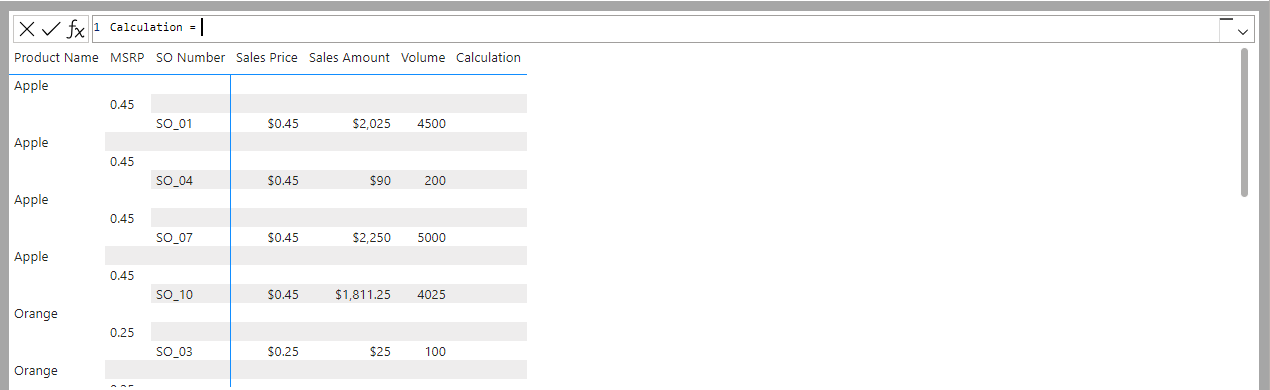
You should have a focused half page pop up in your view. In here we can create our DAX and see a preview of what the formula does.
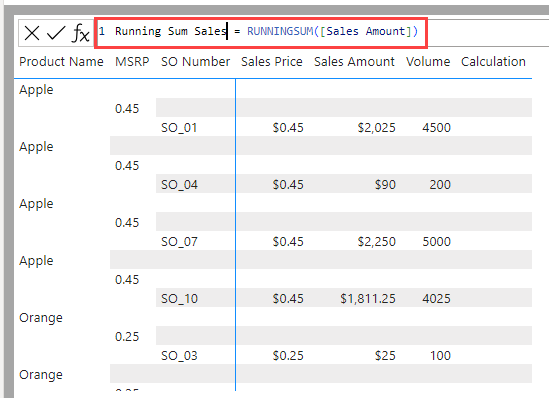
Now let’s type out or formula. Notice that your columns need to be inside of your visual. If you want to remove your columns you can always hide them on the Build a Visual tab so that you don’t break your calculation.
Here is my final table on my report page.
Conclusion
Visual calculations are a new feature that has opened the door for lots of further uses. Because they grab the data from the visual and not the original tables, they allow a lot more accurate calculations to your specifications. If you enjoyed this blog, you should check out some other EPM Strategy blogs linked below.
Links Related to This Blog:
Comments
Leave a Reply
You must be logged in to post a comment.