Power BI – Top N
BY: Morgan Lundeen
Introduction
Power BI Desktop has several levels of filters that can narrow-down and clarify large amounts of data. There are filters for individual visuals, for the entire page, or for all pages. One helpful visual-level filter to know is how to use the Top N filter.
This blog will go over when to use the Top N filter, any common problems that occur when using this filter, and a walkthrough on how to use it.
When To Use It
Using large amounts of data can quickly become overwhelming and insights can become hard to find. One way to quickly identify items that need the most attention, either good or bad, is to filter visuals to only include the top number of items based on a specified variable, which is what the Top N filter allows us to do. For example, it could be helpful to know which store locations have the highest total sales for a given period, or conversely, it could be helpful to know which products have the lowest sales amount. Thus, special attention can be given to what is either working or not working to drive improvement.
Common Problems
Sometimes, the Top N filter will return more rows than the specified amount. If there are any ties in the ranked values, the filter will return all the items with the tied value. For example, a filter could be applied to return the employees with the top five highest salaries, but if there are ten employees with equal salaries, the table will return all ten employees. In some cases, this could be desirable, whereas other scenarios could require only five results. In that case, a custom measure could be created to rank the items according to more than one variable and return a unique value for each item, allowing the Top N filter to return only the specified number of rows.
Walkthrough
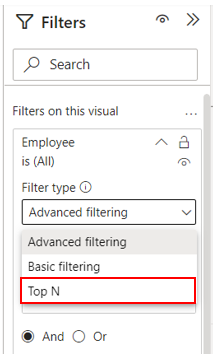
This example walkthrough uses a table visual, but the Top N filter can be used on many different types of visuals. Using the employee salary example, I have created a simple table with 20 employees and their respective salaries. Under “Filters on this visual” on the filters panel, clicking the dropdown arrow for filter type gives three options: Advanced filtering, Basic filtering, and Top N.
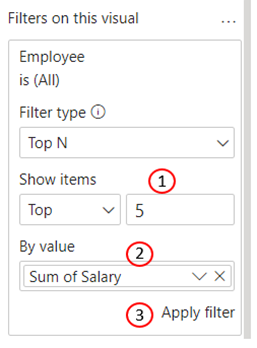
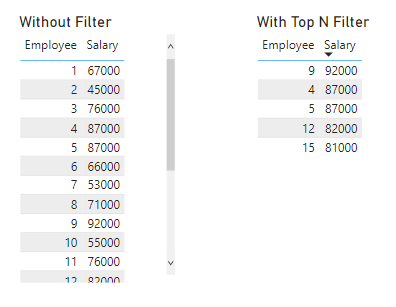
After selecting Top N, we are given a textbox to enter the number of items to be returned, in this case 5 (1), where to specify which variable to rank the items by, in this case employee salary (2), and an apply filter button (3). There is also a dropdown arrow by “Top”, which can be changed to “Bottom”. After applying the filter, the list of 20 employees is narrowed down to only include the employees with the top 5 salaries.
Conclusion
Using visual-level filters such as Top N can make it easier to interpret and glean insights from large amounts of data.
Comments
Leave a Reply
You must be logged in to post a comment.