Power BI – Max and Min Date Slicers
By: David Rohlfs
Introduction
If you have been using Power BI for a while you have probably learned the importance of having a Date Dimension. Although it is great to have, there are some aggravating aspects to using a Date Dim like having a slicer that only shows dates that were used in the data. One remedy to this is to have DAX formulas that take away all the unused dates.
In this blog we will go over when to use a max and min date formula and a walkthrough implementing the formula to a slicer.
When to use it
One of the frustrating things about using a date dimension is that you can easily run into the problem that your data and slicers are presented by a large set of dates instead of dates that contain data from your fact table. For example, your fact table has data from 2021-2024, but your date dimension has dates from 2015-2030. When you start creating slicers based on your date dimension, your dates will be from 2015-2030. While it is easy for a report developer to understand that there are empty dates, it can be difficult for an end user to remember which dates have data. For this reason, we want to create a filter that only allows for dates within the min and max date from your fact table.
I will explain the process more in the walkthrough, but to do this we are going to create a true or false calculated column in our date table that determines whether a day is used in the fact table or not. With this column, we will create a locked filter on all pages so that the end users don’t accidentally change anything.
In theory you can do this inside of power query as well, but the process is more complicated because you will need to reference outside queries. I plan to create a blog about this in the future, but for now, the DAX solution is easier to read and simpler to implement.
Walkthrough
For this walkthrough we are going to keep it fairly simple. There will be one fact table and one date dimension. If you have more than one fact table you will want to add some other conditions to your formula, but it shouldn’t be too complicated.
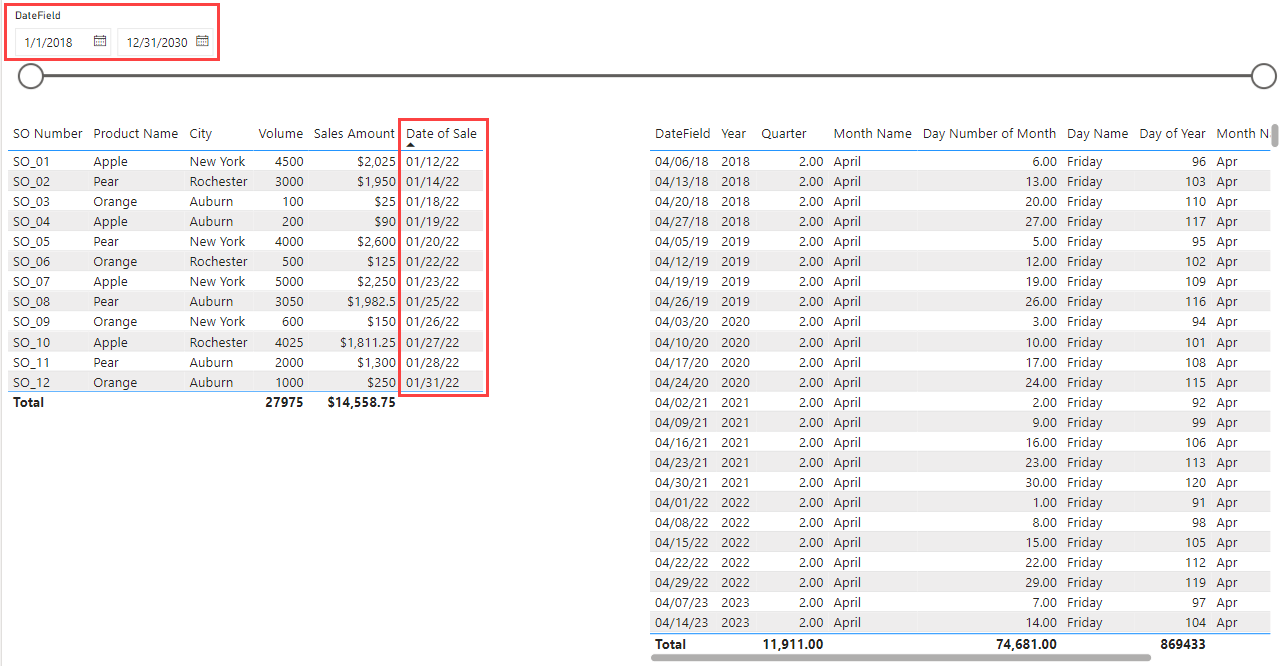
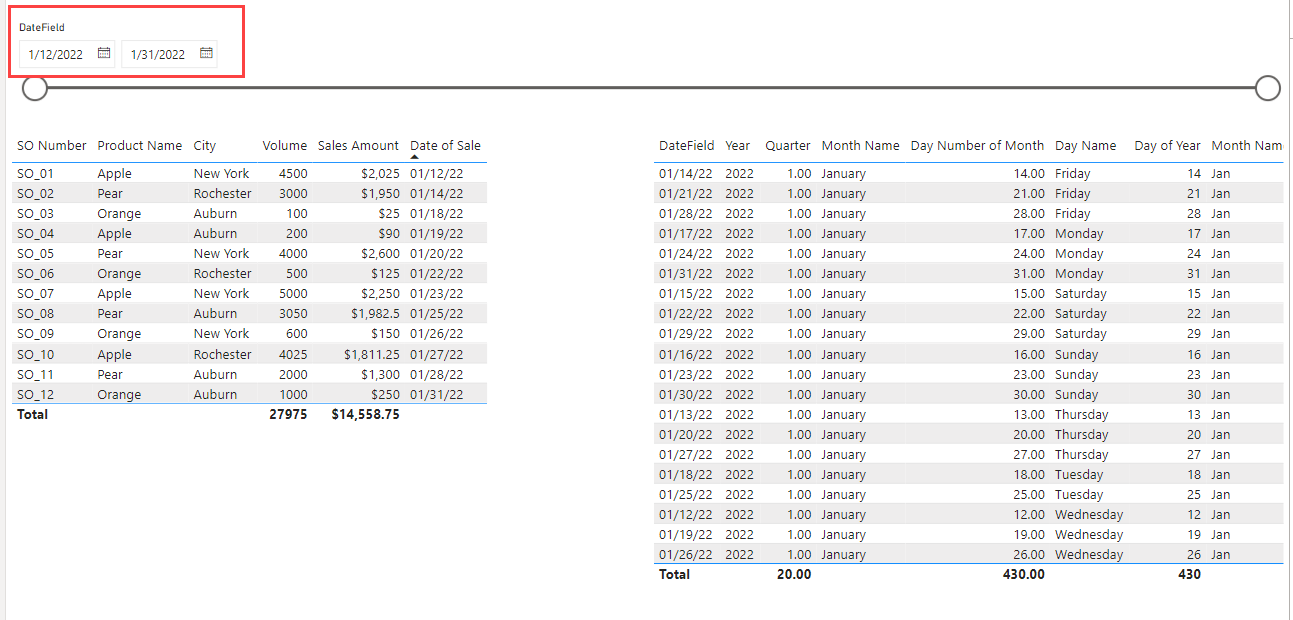
Here is our fact table and date dimension. Notice that my slicer at the top has dates from 2018 through 2030 but my fact table on the left only has sales from January 2022. The end user for this report will have a struggle filtering for the dates because there is such a large option when the filter would only work for a few of the dates entirely.
Let’s go ahead and create the DAX for this method. To do this I am only going to use one calculated column. If your dates are not correct for some reason, I suggest placing the Max or Min variables into a measure and checking the date for these values.
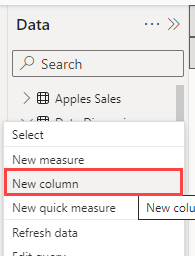
To create a calculated column, we are going to click on the ellipses in our date dimension table in the data pane on the right. Then click on New Column. This will bring up a DAX equation bar just under the headers on your desktop app.
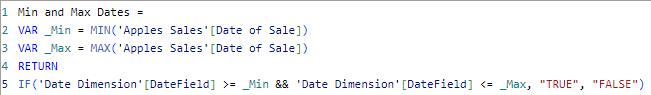
In here we are going to do three things. We are going to create two variables that find the starting value and ending value in your fact table, and we are going to create a condition that says if your date from your date dimension is between those two values then TRUE. I am not going to give you the DAX for this, but you are welcome to copy it from my screenshot. Here is my DAX for this equation:
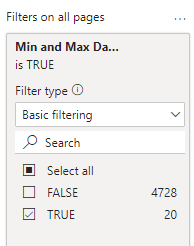
Once this new calculated column is created, we need to filter our pages with it. This is very simple because my goal is to filter all pages. All you need to do is drag your calculated column from your date dimension to the Filter on All Pages location in the filters pane. Once it is there you can select the TRUE value.
- You either need to filter entire page or filter all pages or else some of your visuals will NOT work.
Now let’s lock down this filter so that it can’t be accidentally changed later. All you need to do is click on the padlock icon inside of the filter. I am also going to hide this filter as it is not relevant to the data. To do this you just click on the eye icon.

Once this filter has been applied you can see that my slicers reflect the dates that are active inside of my date dimension.
Conclusion
Creating a good report is all about creating a report that is easy to navigate and read. When there are unused pieces of data that are not relevant to the fact data it is important to not let them distract from the important information. Hopefully you enjoyed this blog and learned something new about date dimensions and if you did you should check out some of the related blogs linked below.
Links to Related Blogs:
Comments
Leave a Reply
You must be logged in to post a comment.