Power BI Counting Text
BY: David Rohlfs
Introduction
Counting Text in Power BI is oddly difficult if you don’t know how to do it. So, this blog explains how to do exactly that and tells you when it is best to use this, common problems that are encountered, and has a walkthrough of two examples counting text and giving the report builder a numerical value from the text.
When to use it
Counting text can be very helpful because it allows the report builder to gain a numerical value from a text list. This value can be used in:
- Cards
- Visuals
- Equations
- Matrixes or Tables
- As a reference value for the Report Builder
If you go through the Walkthrough section below, you will do an example that uses DAX. This example creates a value that you can use in other equations. Making the Dax Formula very helpful in a lot of situations.
Common Problems
Changing the Format inside of the field doesn’t get rid of any unwanted values.
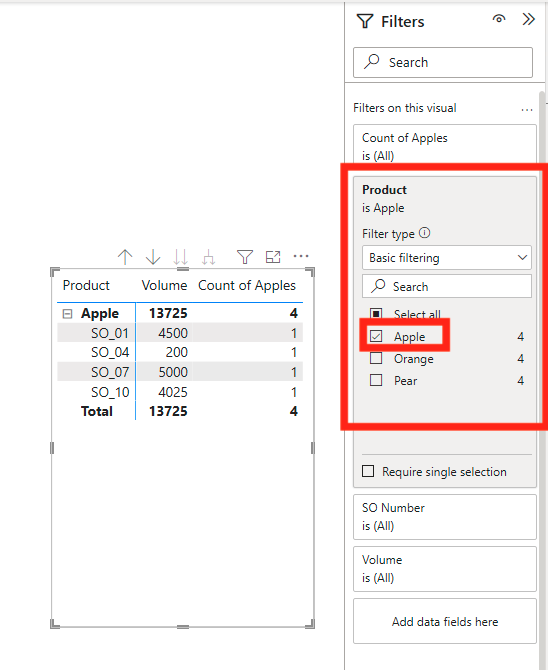
I briefly mention using filters at the bottom of the first example. What you will want to do is click on the visual that you have and apply a filter to it on the report page. You can also apply this filter to the entire page, and the whole report.
For this example, I am applying a filter to the product so that I only have apples.
Subtotal Issues
I encountered a slight problem where the matrix showed a subtotal of the apples for all three products.
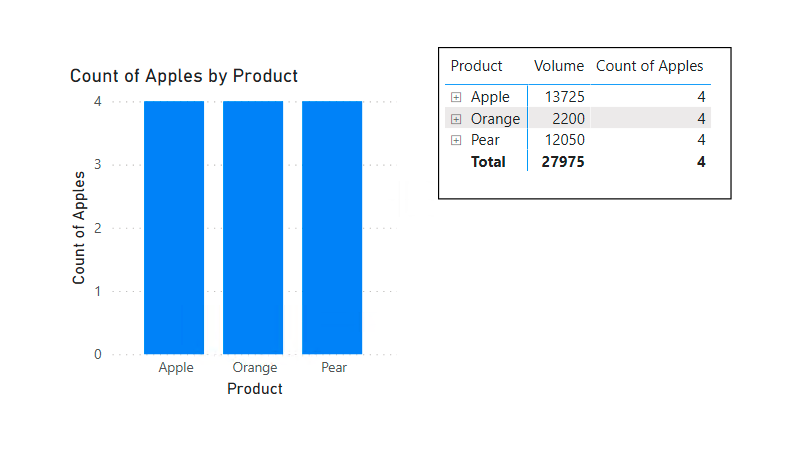
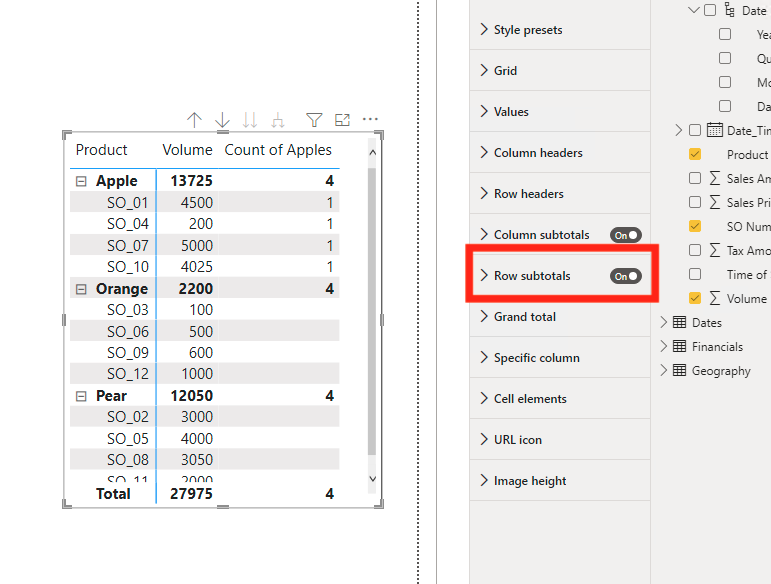
What is happening is that you are creating a value for the whole column, and Power BI is showing you that value for all your subtotals since they are all from the same column. In other words, I am using my reference column as the Rows input and the value input, so Power BI is getting confused. To fix this easily you can either eliminate the reference column from the Rows or turn off the subtotals in the visual settings.
Walkthrough
In this walkthrough, we are going to count the word “Apples” in a text column. Although this example is for a very small data set, it should work on data sets of any size. To do this we are going to go through two quick examples.
The first example will be changing the aggregation on the field. This is very simple, but it is much less useful than the second example.
In the second example we are going to create a new measure and write a small amount of DAX. This will then give a number that you can use in other equations or other visuals.
Example 1
For the first example, set up a matrix so that we can see the changes happening to our data.
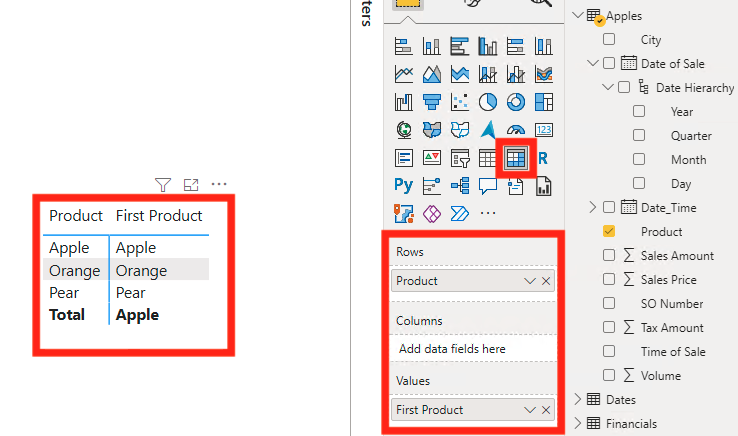
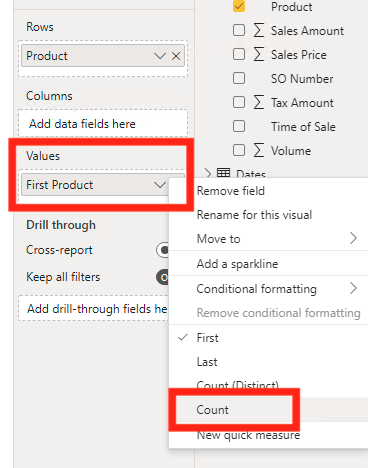
Next click on the arrow for the field that you want to count, then click on count (or any other action that you want to see).
Now you can see that our data has changed from a Sum to a Count.
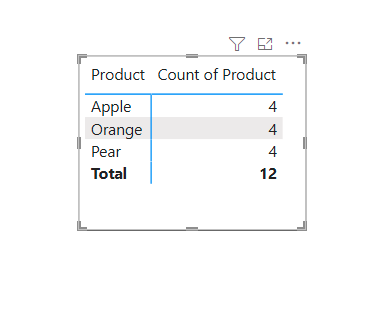
Because of my semantic model, all the products came out to 4. In many situations I would suggest checking on this, but because I know that each product has four occurrences in my semantic model, I am not going to check.
Notice that this example doesn’t change the data, but instead changes how you see the data.
Note: for this example, you can change your data by using a filter. Then you can manually take out all the excess data except for the fields you want (Look at Common Problems above).
Example 2
For the next example we will go through a small amount of DAX to return a number that can then be used in other formulas or visuals.
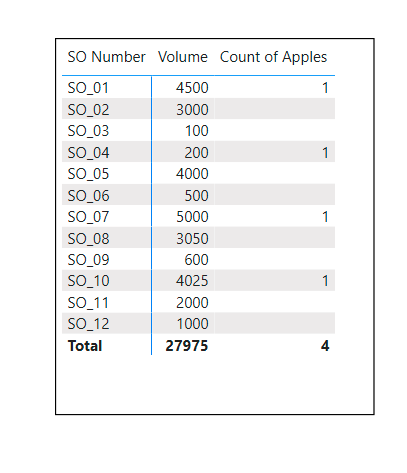
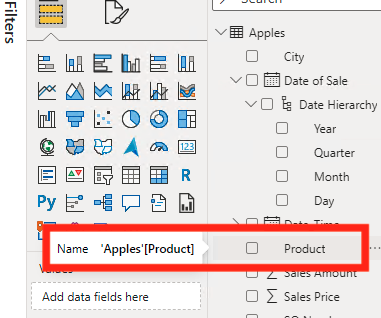
First you will want to identify the field that you are going to be counting (I like to write this down so that I don’t forget). While doing this I also created a quick matrix with the information that we will be looking at. This is a good practice to check if your DAX is correct. (I added the volume column so that I had something to fill in my table while there was no counting column, so it is arbitrary).
Now we will create a new measure by right clicking on the query that we are creating the measure in. Then selecting New Measure.
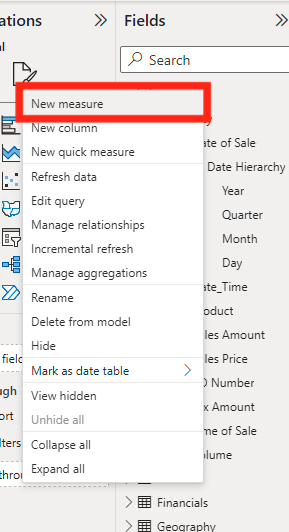
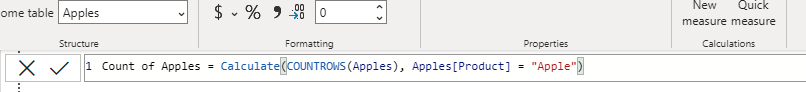
Now you will see a bar appear at the top of your report. This is where we will be writing our DAX. Remember to name your new measures. You do this by typing the title, then the equals (=) sign. For this example, I am going to enter this equation.
Title = Calculate(Countrows(Table), Table[Field] = “Name”)
Now you will see your counted field appear under your fields list. I am going to put this into a matrix so that we can check our results. This field is the result from your DAX, and you can use this in other formulas, cards, visuals, tables, etc.
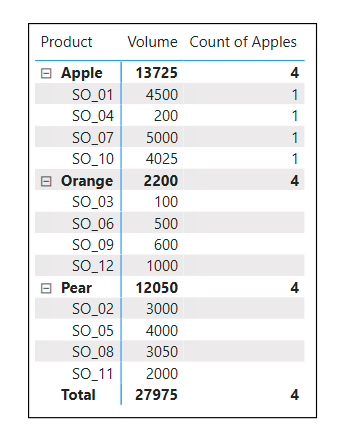
You may encounter a problem with your visual or matrix where all the subtotals for this measure are showing the same value. If this occurs look at Common Problems above under Subtotal Issues.
Sometimes you need to know how many occurrences of a text field are in your data. Using the Count Text function is a great way to discover this information.
Comments
Leave a Reply
You must be logged in to post a comment.