Power BI – Apps, Workspaces, Dashboards, Reports and semantic models Defined
By: Collin Quiring
With any specific technology, understanding the terminology of the toolset is important. And, with the term “application” and the way that Power Bi is used on Desktop and Service I thought I would give an attempt at helping give some clarification. I will give the basic definitions and then try to explain how it all works together in the world of Power BI.
Definitions
semantic model – the source of data ready for reporting and visualization. A semantic model is sometimes called a model as well but in the Power BI terminology, it should be referred to as a semantic model. The semantic model is created by connecting to data and making it available to be used in Power BI. A semantic model could be made up of many different data sources (web pages, Excel, SQL, SharePoint, OneDrive files, other applications like Twitter, Facebook or Quickbooks) combined
Report – this is the way to represent your data. The data is represented in visuals – which can be a basic textual table to a highly graphic interactive and colorful view. This is the visual representation of your semantic model.
Dashboard – the dashboard is accessible on the service only. A dashboard is a page, or canvas, that uses the visualizations from the report page. It can be a selection of specific visuals from one or many different reports. Or, it can be an entire report page (tab) pinned as a dashboard. Or, it could be any combination of specific visuals or entire pages (tabs). And, it can be created with almost any combination from different reports.
Workspace – the way to create collections of dashboards, reports and semantic models. This is the environment to “group” reports, dashboards and semantic models in a logical manner (particularly for sharing).
App – this is the method to bundle together a Workspace collection to be able to distribute to a broader audience. This has the most restrictive amount of security (out of the box) and limits the ability to manipulate the data (out of the box). The way that I think of an APP is that it is a workspace with more limits on it – particularly in the way of security (again, standard settings, as with most things, you can open the security up a bit if you so desire).
The process
In this example, I am going to be using the Desktop and Service. There are many ways to do this – you can do it all on the Service. You can create dataflows. You can use API’s. There are many different ways to create the semantic model, make a report and then create a dashboard. This is probably the most commonly used methodology, but is not the only way.
semantic model – obtain the data by using the Desktop Power BI Get Data function
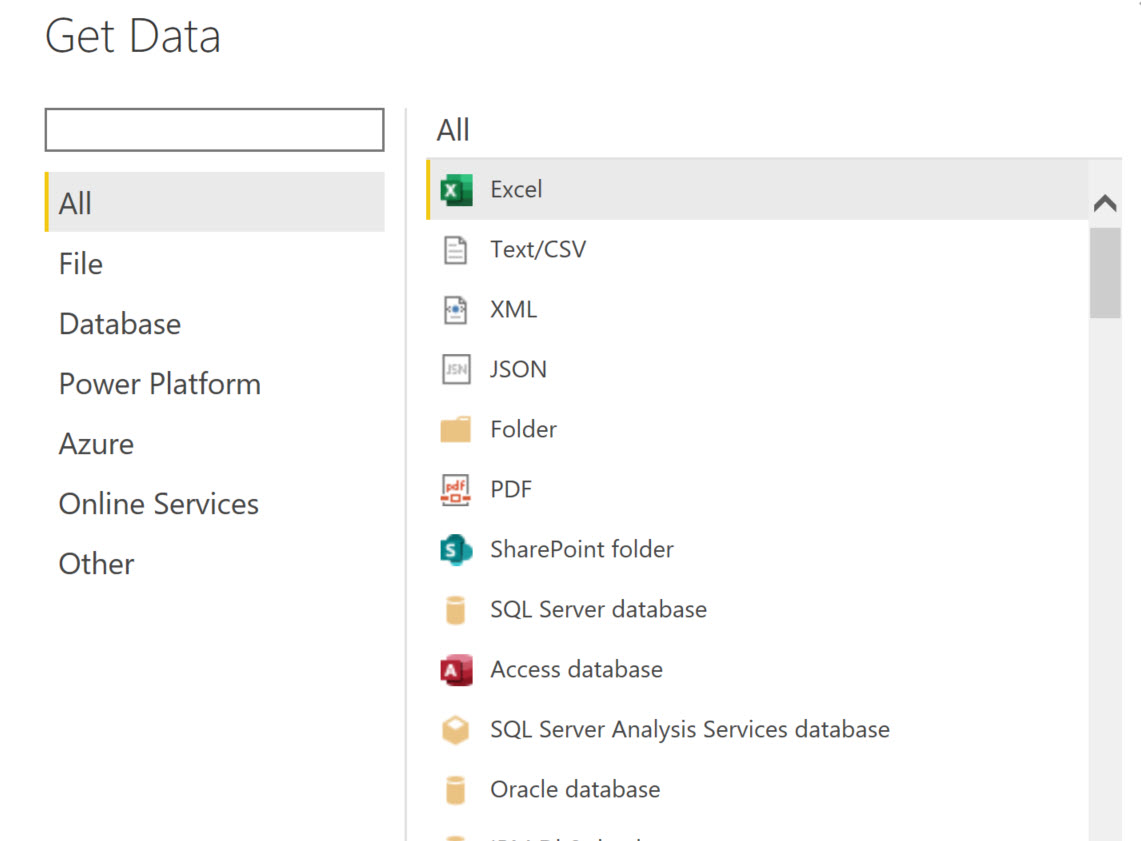
This results in my semantic model – all the queries representing the data that I have brought into my file.

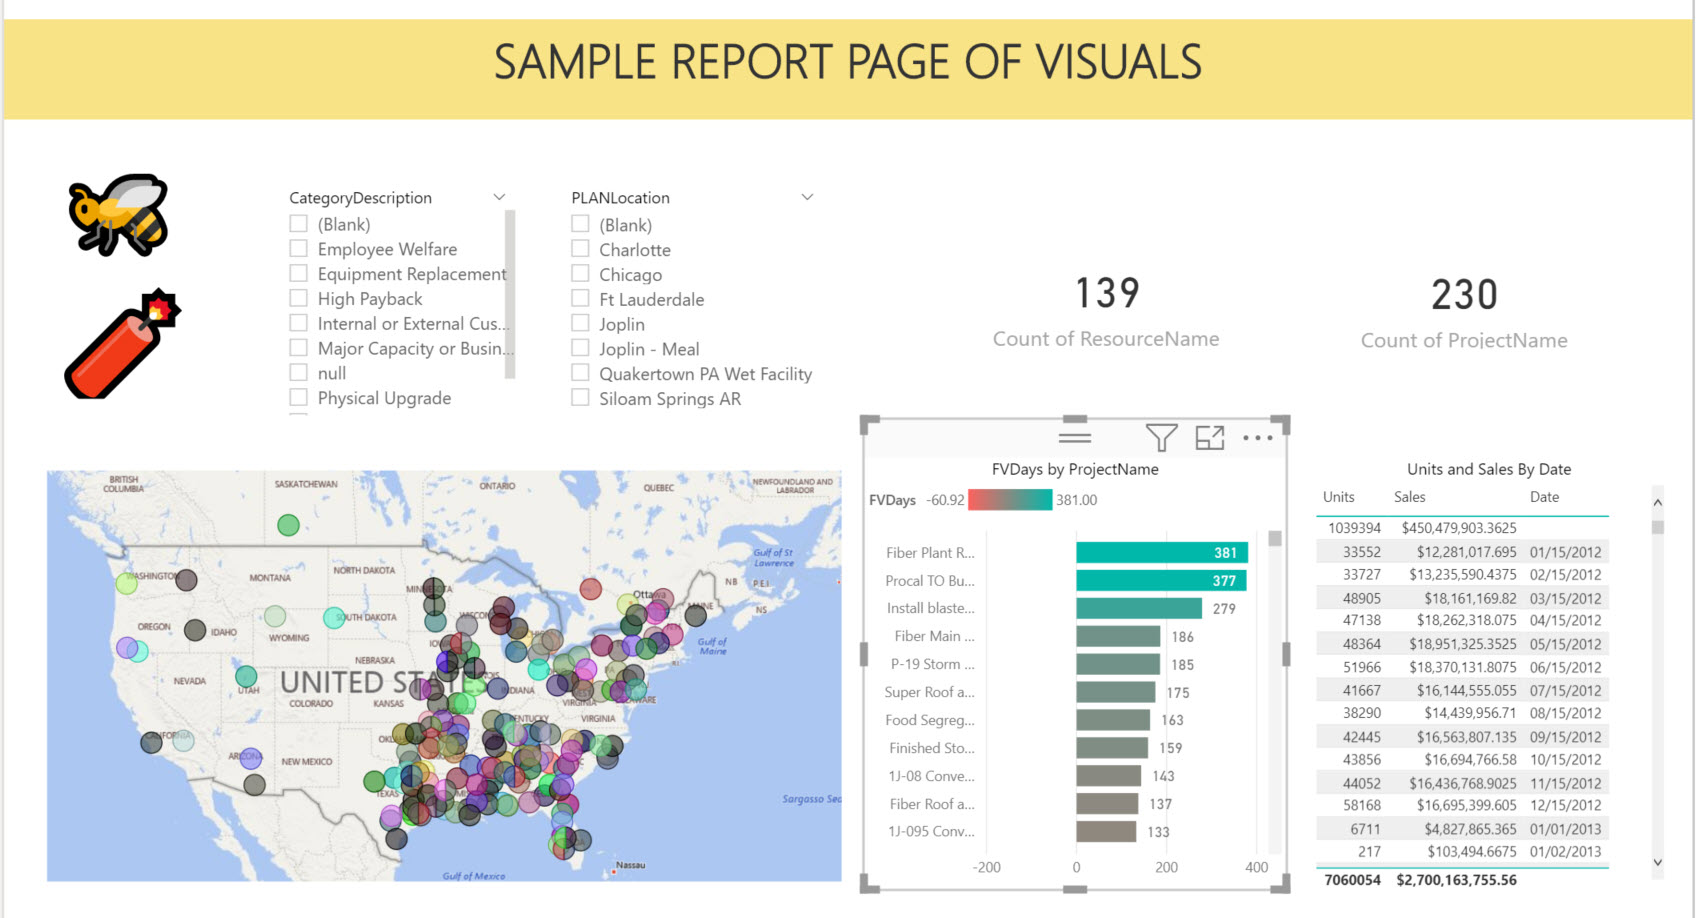
Report – when the semantic model is done being created, you use the various visuals to create the report. This is a simple example with a map, two slicers, a couple emojis, a couple cards, a table and a stacked bar chart.
Now that I have this saved on the desktop, I am going to go to the Service and create a new Workspace to put the Report and semantic model. The semantic model automatically follows with the report when it is published.
In the Service, I create a workspace called Sample Test.

I now have an empty workspace – no reports, semantic models or dashboards in the workspace.

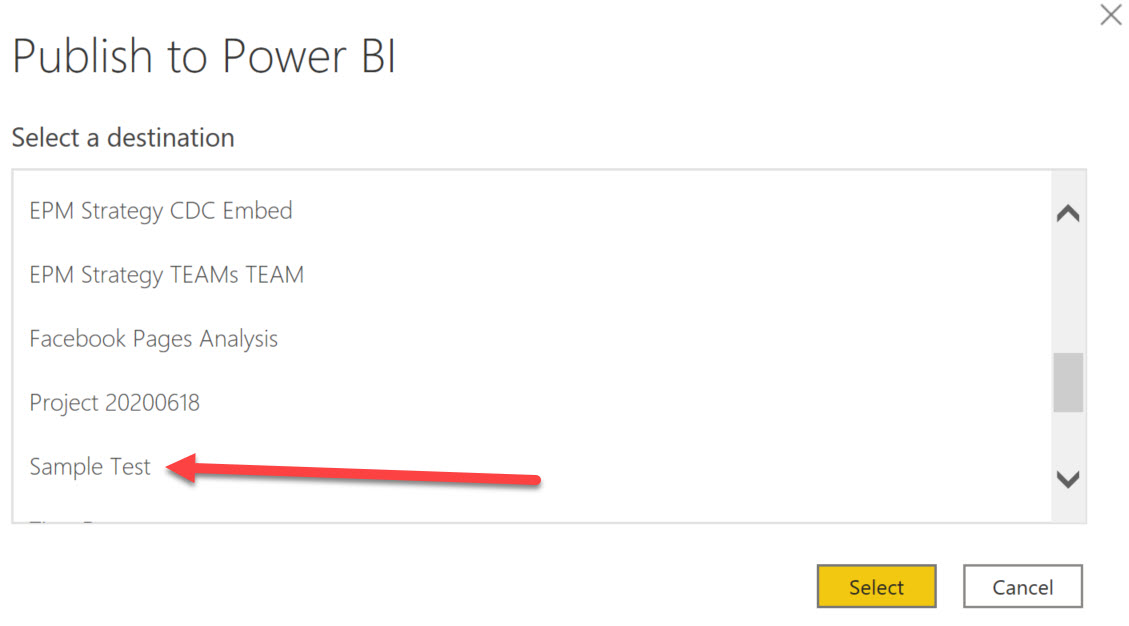
Going back to Desktop, I opened my .pbix file, called “TestingStuff2” and I publish to the Workspace that I just created.
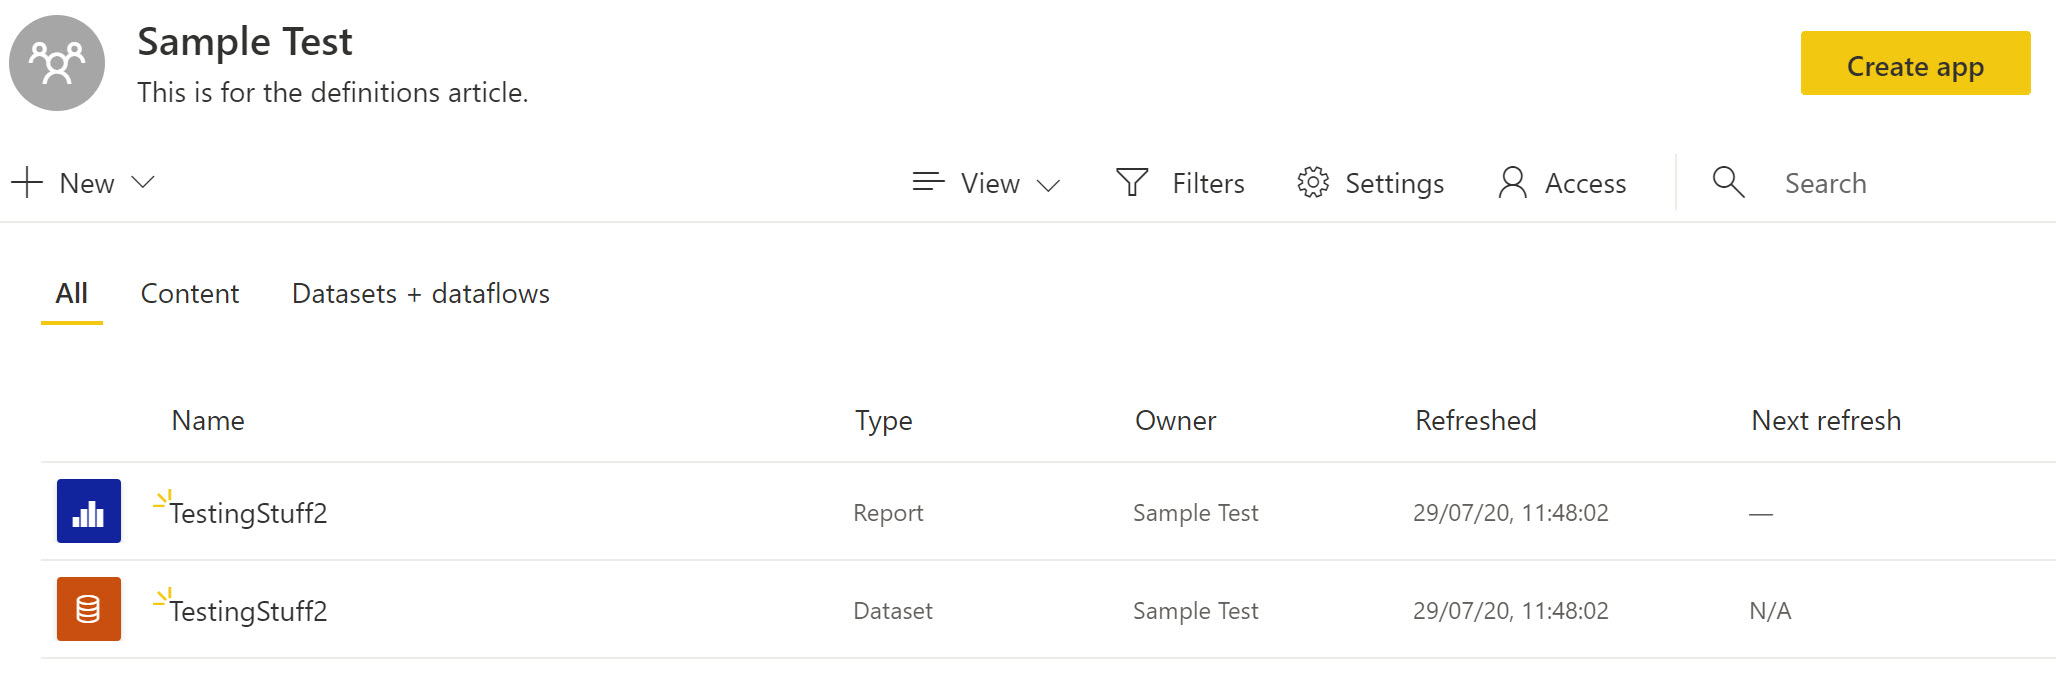
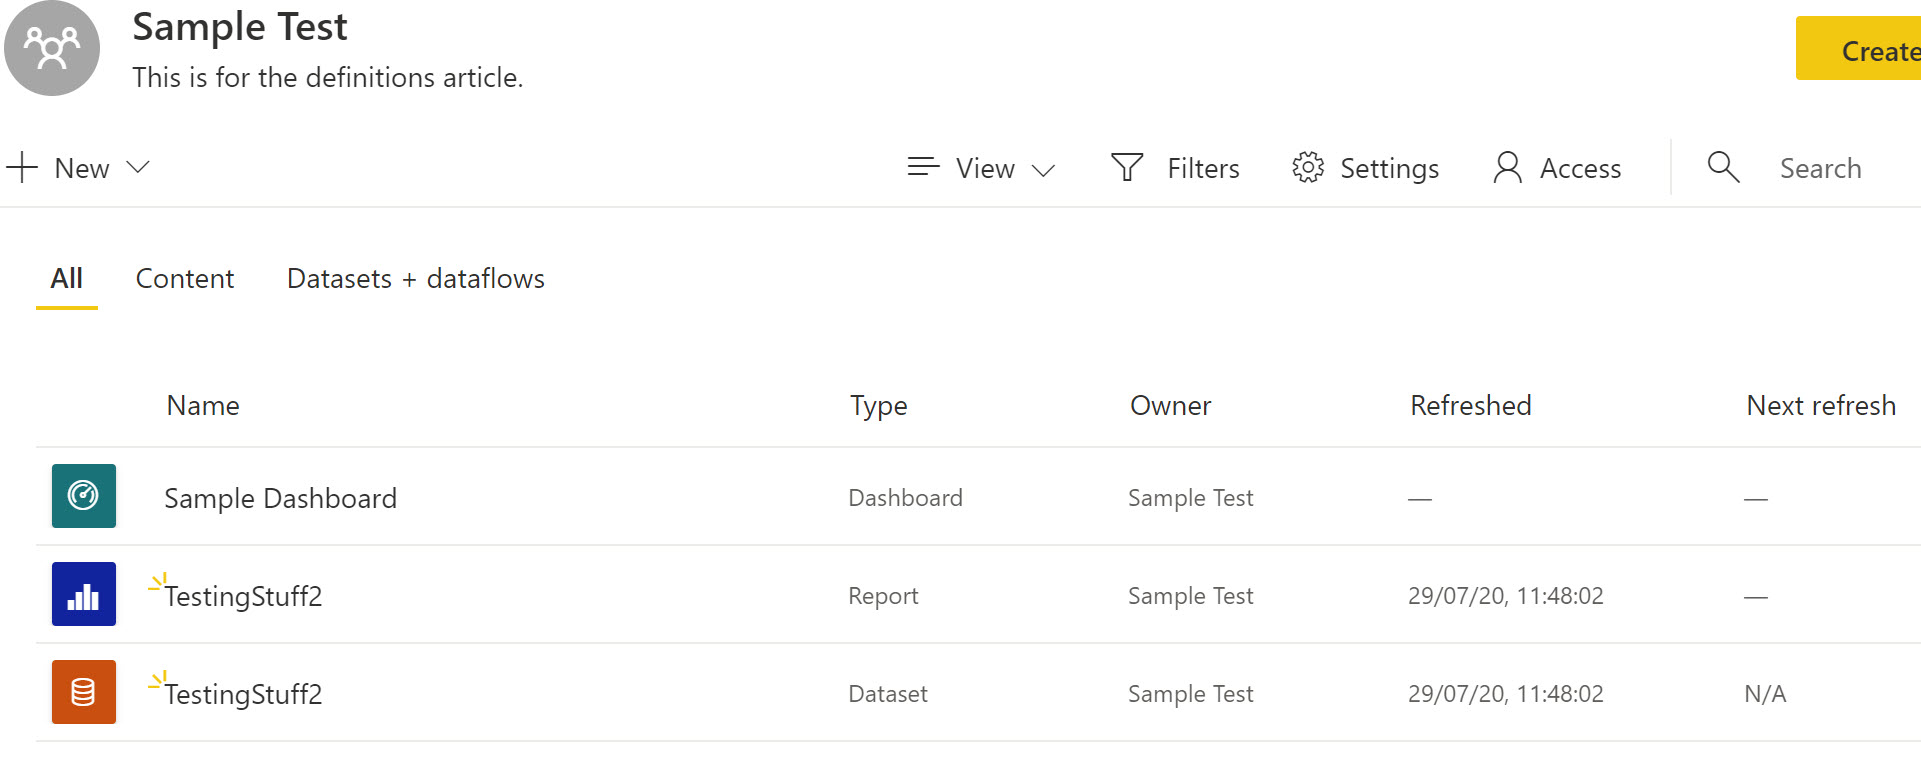
In my workspace, I have the semantic model and the report. But, no dashboard and no app (because I haven’t created them yet).
In some cases, if you have relatively open permissions for users, all you have to do now is share the workspace and the users can interact with your report and semantic model.
However, for our example here, we are going to create the Dashboard. In this case, I am only going to pin the entire report page but remember that you can mix and match and select only specific individuals if you prefer.
I am naming the Dashboard as “Sample Dashboard” to make it easy for us to find.

We now have the Dashboard in our Workspace.
This article is not about security. You should investigate the differences in security and your options with each type of content (Dashboard, Report, App). Therefore, we will now just create the App for our Dashboard to be placed into. Select “Create App” in the top right corner of the Workspace screen.
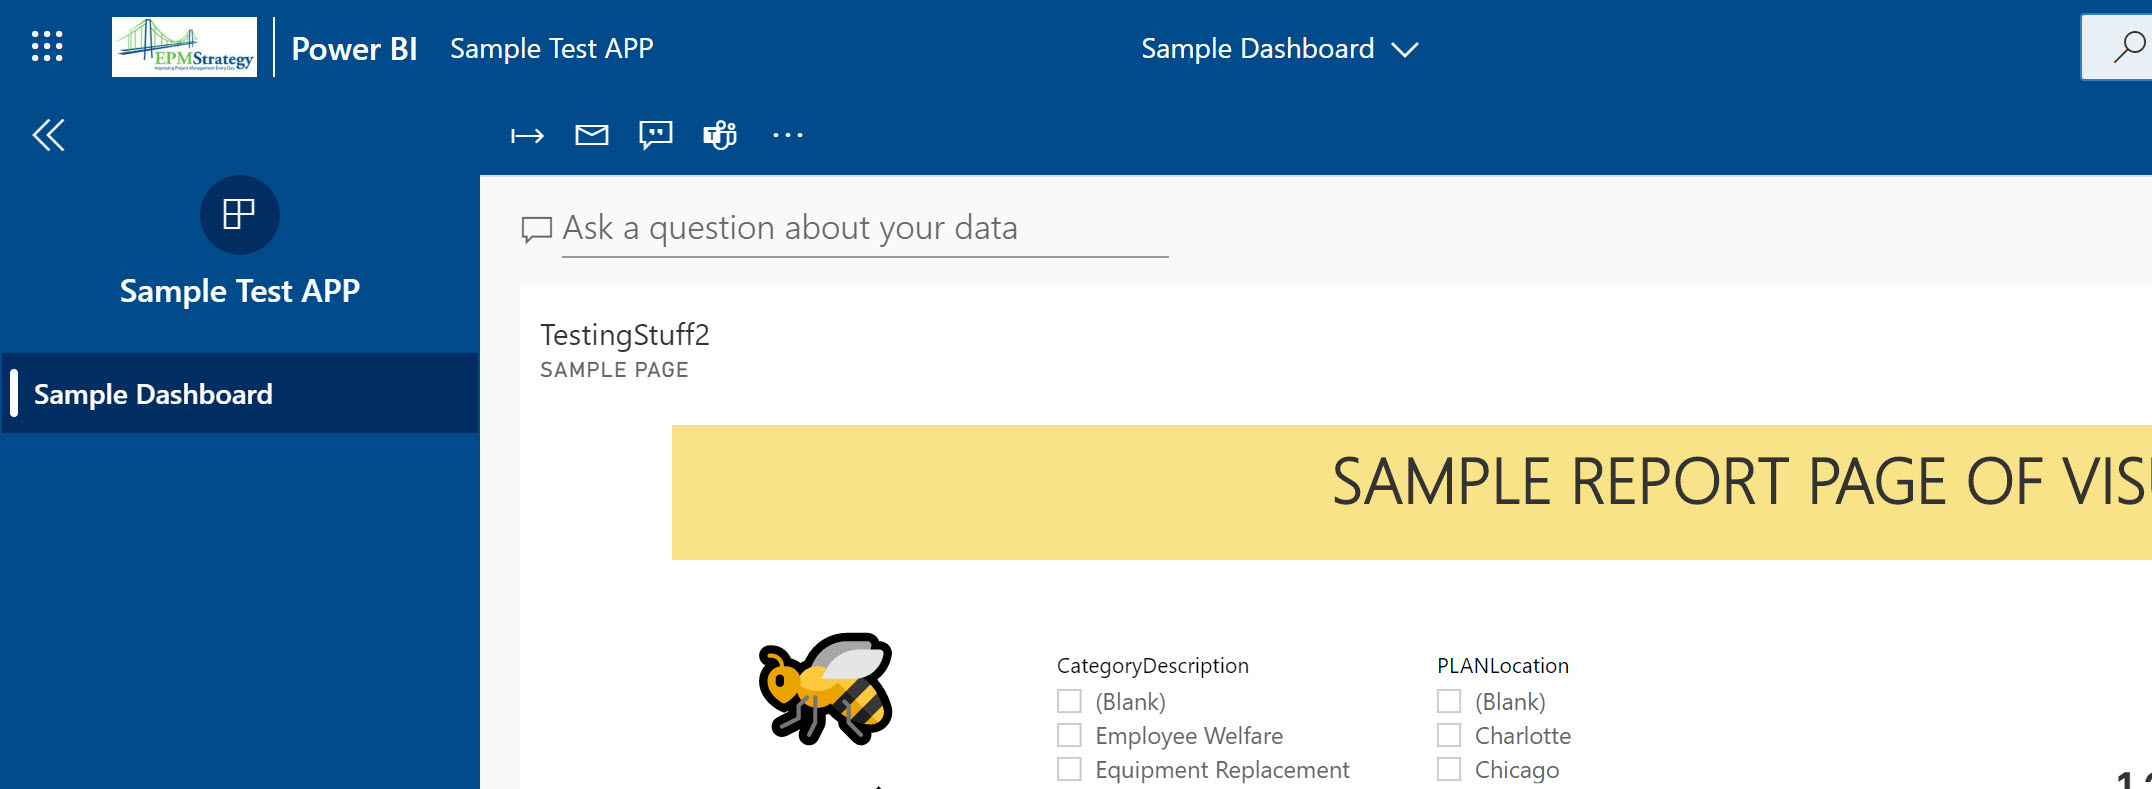
In this case, I called the APP as “Sample Test APP”. Based on my security needs, I modify the navigation and Permissions options appropriately.

After publishing the app, I now have my app. In my case, I was quite restrictive and only my dashboard is visible and able to be interacted with in my app.
As always, there are numerous decisions, like security, to make along the way and more than one way to do this process. But, this article is just about trying to clarify the differences between these terms.
Comments
Leave a Reply
You must be logged in to post a comment.