Creating a Mobile Optimized View in Microsoft Power BI Desktop
BY: David Rohlfs
Introduction
When most people think of mobile apps for business needs, they probably think of the outdated squished view that you really can’t do anything with. Fortunately, since Microsoft is such a big corporation, they have made a Power BI specific app that is available to download. You are able to get this app for free on an Appstore and use the same login that you would use for your normal Power BI Service.
This blog will go over how to create a mobile device specific view for a report in Power BI Desktop and quickly demonstrate why you may want to do this.
When to use it
There are a lot of times that you don’t want to grab a laptop or have to login to a desktop to look at a report. When you develop a mobile view, you are taking what would be a hard to read report on a mobile device and turning it into something easy to understand and simple for any user to access.
Here is a comedically funny scenario of when it could be nice to develop a mobile view:
Imagine this: You are stranded on an island and all you want to know is what your sales figures where for last month. There is no hope of a laptop washing ashore, but you do have your phone with the Microsoft Power BI App installed. You navigate to this app and find your report. It is elegant and perfectly laid out so that it is easy to read on your phone and you find those prized sales figures that you were looking for.
Although this scenario is unlikely and impractical, it depicts the idea that as long as you have access to phone service, you can access the reports that you need to. There are a lot more practical times when you would want to access a report like:
- On the Golf Course
- At home watching television
- Whenever you forget your computer
- Away from your computer in the office
- And any situation that you want to access a Power BI report without being at a computer.
When you go into the Microsoft Power BI App, you’ll see all the reports and workspaces that you already have access to. In here you can do a lot of stuff that we won’t cover in this blog but using this app can save you a lot of time and effort. But when you go into reading a report, you’ll see that it looks the same as when you pull it up on a computer. There is a way to customize this view into a mobile specific report. To learn how to do this, you can scroll down to the walkthrough section of this blog.
Here is a comparison of a report that has not been formatted to fit the mobile view, and a report that has.
Not Formatted to Mobile View:
Formatted to Mobile View:

You can see that I didn’t put every visual from the normal desktop view into the mobile view. This was on purpose and for a great reason. When you are building a mobile view, there are really two main things that you need to keep in mind:
- Is my report showing the important information that my End User requires?
- Am I overcrowding my report with too much information?
When you are building this mobile view, there are a couple of things that you should note:
- You only have so much space with this view.
- Your visuals will come from the main report view. So, you won’t be able to create any more visuals just for a mobile view.
- You can still have multiple pages in the mobile view.
- Less is more when someone just wants to see important information.
- If you don’t have a mobile view setup, you will still be able to access the main report from the Power BI App. Although it won’t fit most mobile devices comfortably.
Both of these questions are meant to make you think about what is going into this mobile view. I know that when I am creating a report, I am usually working on a large screen so that I can see everything easily. But when you are building a mobile view, you NEED to make sure that you think about how the end user is accessing the information. Most mobile devices have screens between 5 to 8 inches. So, there is not much real estate when you are developing this view. To choose the most important visuals, you should treat it similar to how you may treat a dashboard. Only the most important information to a specific person or group should be in the report. This may be Cards, KPI’s, simple column or line charts, etc. The goal of this view isn’t to build the most complex and in-depth report, but instead to make it as simple as possible to read and understand.
One tip that I have about creating mobile views is that you should always test them out on your personal workspace first. I know I keep saying it in this blog, but you need to remember that the size of your screen you are building the report on is much bigger than the size of the screen your end user will be looking at the mobile view on.
Common Problems
The most common problem that I have encountered with the mobile view is that some visuals don’t work well. This is usually because it is a visual that is meant to be large like an in-depth clustered column chart, or a map visual. It is pretty easy to see this when creating the mobile view, but you should always remember that the screen you are working on won’t be the same size that the end user will be using (specifically for the mobile view).
Walkthrough
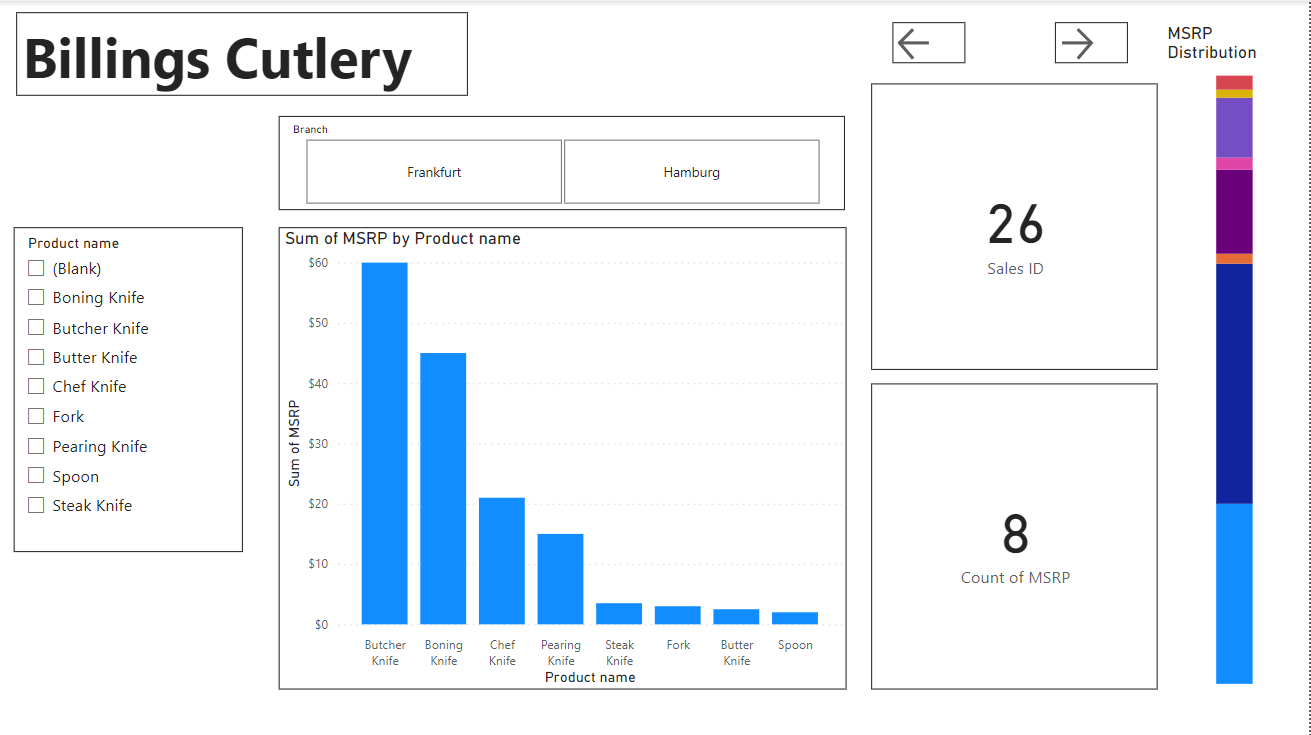
Before we start with creating the mobile view, I want to show you what the main page of the desktop looks like. In here we have a lot of visuals and fancy slicers. This is great when you are making a report for a desktop, but this would be almost unusable if you just opened it up on your phone.

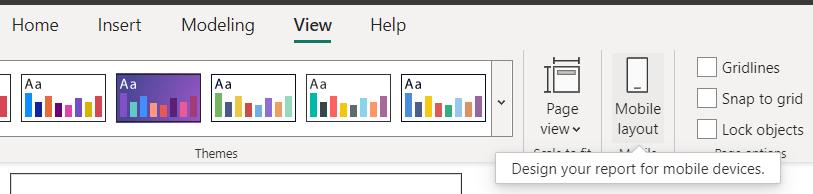
To start, click on the view tab in the ribbon, then select Mobile Layout. This will probably be represented by a little phone icon.
This is what my mobile page looks like before touching anything. The main report page shows that there is nothing in it, and if you haven’t been in this view before, you may have some options checked at the top in “Page Options”. You can remove these (Gridlines and Snap to Grid) by just unchecking the boxes or keep them if you want.
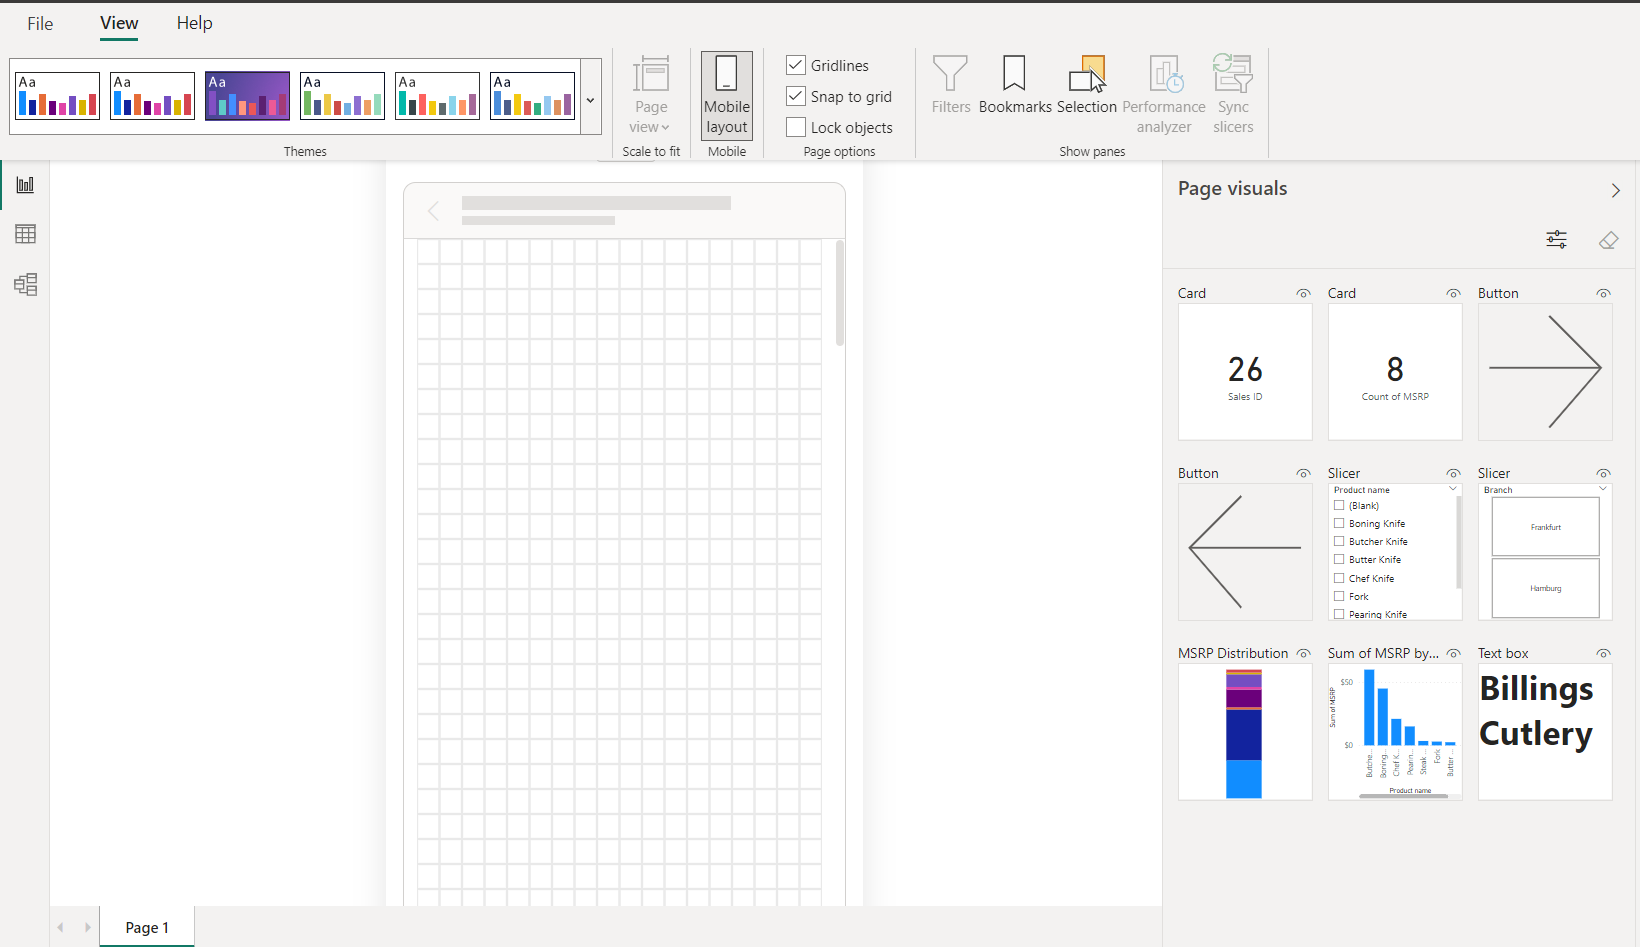
On the right pane you’ll see that we have all the visual tiles that were in our desktop report view.
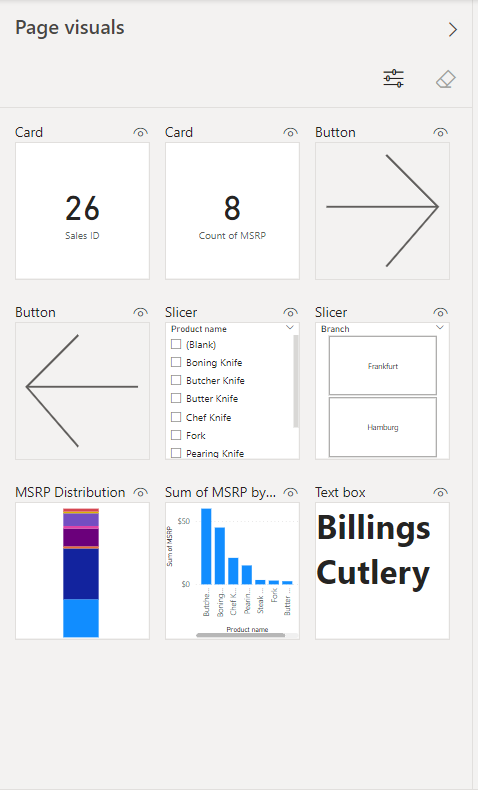
To add these visuals into the mobile view all you need to do is drag and drop them. This is where we will start building our mobile view. There are a couple of things to keep in mind:
- You don’t have much space to work with
- Your end user will be using a very small screen to try and read these visuals
- Less is more
- The mobile view page can scroll. So there is a lot more length than width.
After adding in the visuals that I want, this is what my mobile view report looks like:
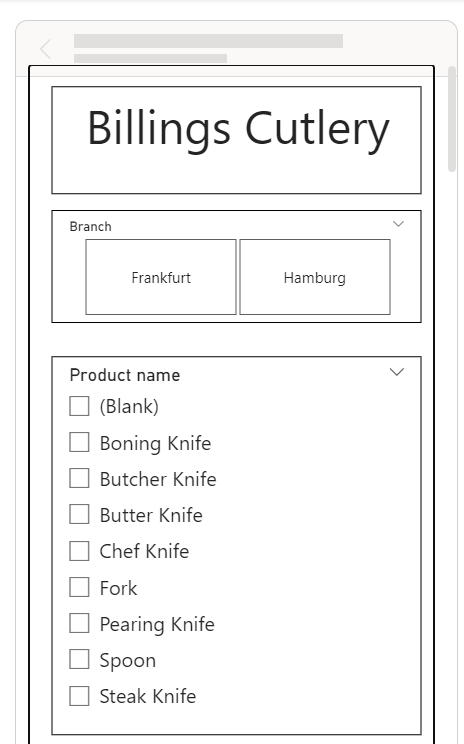
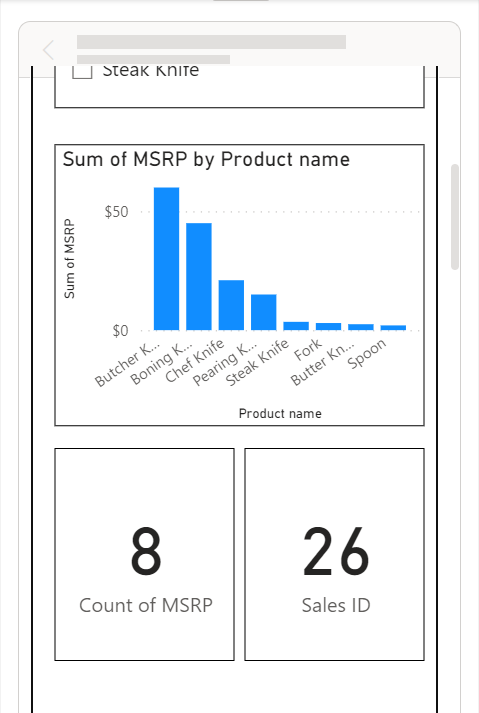
Once you publish this to a workspace, this is the view that anyone will be able to see if they open this page on this report within the mobile app.
Conclusion
While there are many pros and cons to having a mobile view for a report, this is still an aspect of Power BI that can be very useful in the right circumstances. I hope that you learned something new and can use this feature in future reports.
Comments
Leave a Reply
You must be logged in to post a comment.