Power BI – Text Box Dynamic Values
By: David Rohlfs
Introduction
In today’s fast-paced world of data visualization, making your Power BI reports interactive and insightful is more important than ever. One exciting new feature is the ability to incorporate dynamic values into text boxes. By leveraging dynamic text, you can enhance user engagement, highlight key metrics, and ensure that critical information updates automatically as your data evolves. In this blog, we’ll explore when you should incorporate dynamic value text boxes and go through a walkthrough using them.
When to use it
While text boxes are not usually the most popular way to show data in a Power BI report, they now have a feature that makes some popular custom visuals obsolete! While most of us would work with the Enlighten Data Story visuals, the out of the box text box now has a very similar functionality.
Using dynamic values paired with text to elaborate is a popular way to show some key insights into data. Data is a story, and the way that story has been told in the past is through tables, bar charts, cards, and if you’re feeling special you might add a more complicated chart like a Gantt chart. But what if that story could be described to someone as if they were reading a book about it? This is the functionality that the text box dynamic value adds. With this visual you are able to write in a template story and use dynamic values to pull summarized data into the story.
Walkthrough
This walkthrough will be showing the example of adding a dynamic value text box to an existing report.
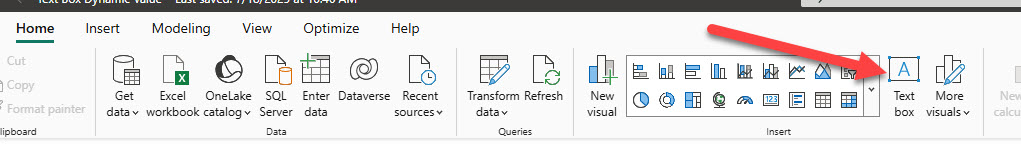
First, we are going to add a text box to our report. You can do this on the insert ribbon or the home ribbon.
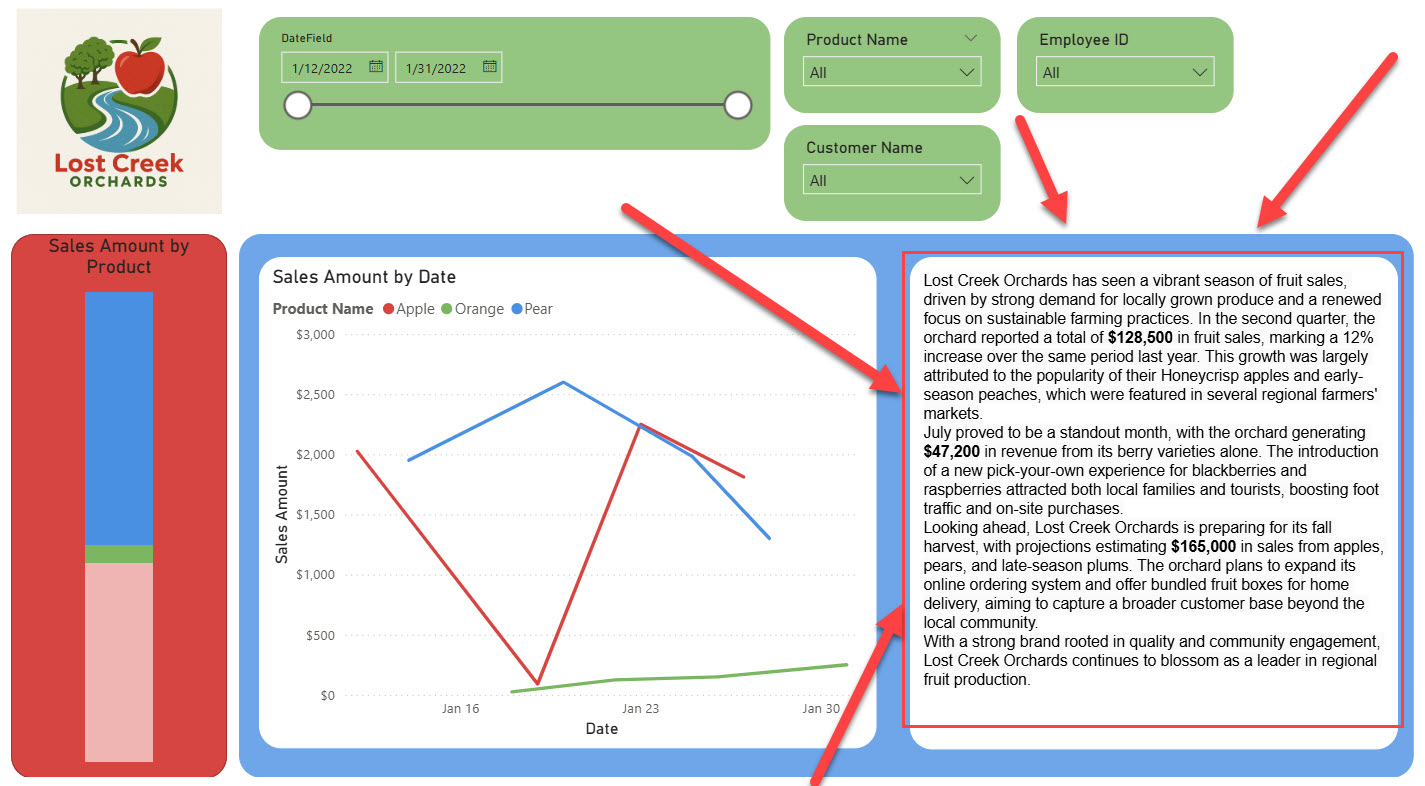
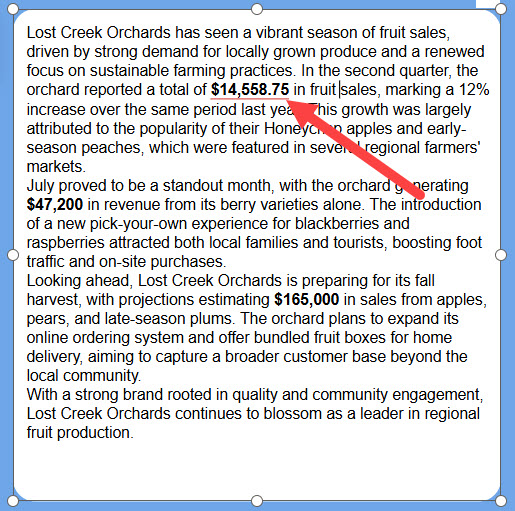
Now let’s write our story. Of course, this part will be more specific to your data, but a simple example is below. Notice that I already put my data value into my draft. This will help you visualize what data you are showing and where. We will replace those values in the next step.
Once you have your story, you’re ready to add in your data! When you have your text box open you should also have this helpful function box as well.
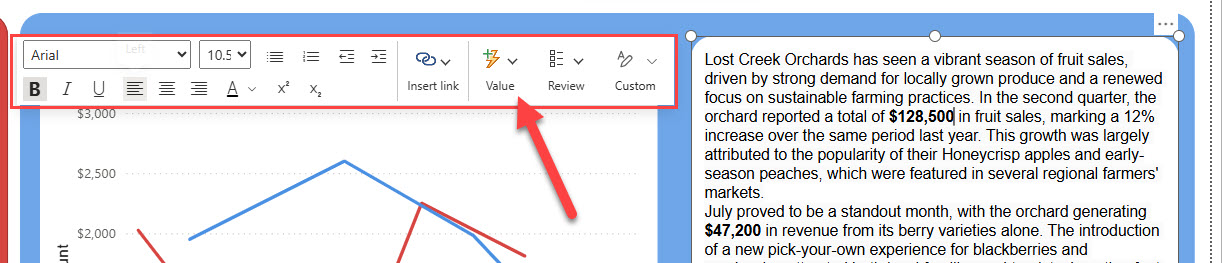
With your placeholder value selected, click on the button that says “Value”. This will give you a pop-out to enter your value.
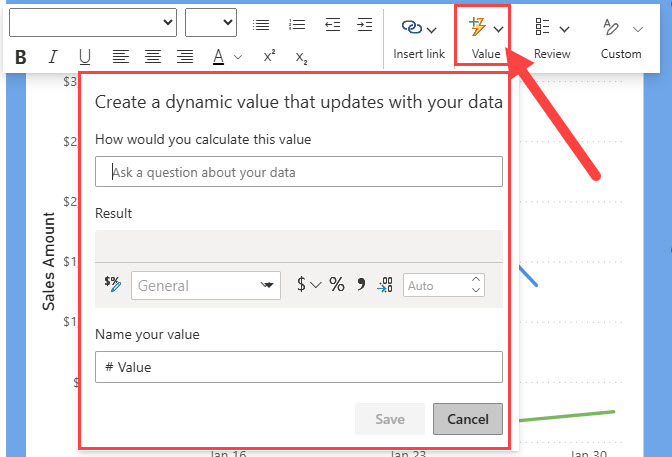
Now enter in your data. This function works similar to the Q&A visual where you need to write what you are looking for. In this case we want all sales. Make sure that what prompt you enter gives you a Result value.
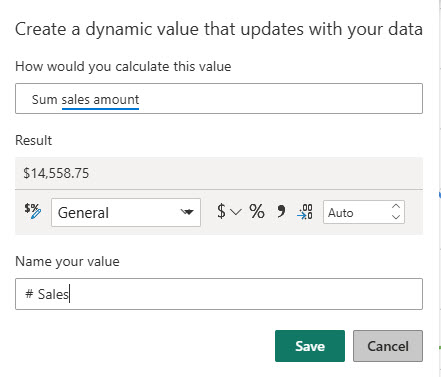
Once everything is ready click Save and your dynamic value will be entered into wherever your cursor was.
Conclusion
Using dynamic value text boxes in Power BI lets you tell your data’s story in a straightforward, engaging way. Instead of just showing numbers and charts, you can add a personal touch—making your reports feel more like a conversation than a spreadsheet. This not only helps your audience understand the key points quickly, but also makes your insights more memorable. Next time you want to share what matters most in your data, try using a dynamic text box and see how much easier it is to connect with your audience. If you’ve enjoyed this blog, check out some other blogs similar to this one below.
Links Related to This Blog:
Comments
Leave a Reply
You must be logged in to post a comment.